FIGURE 3.

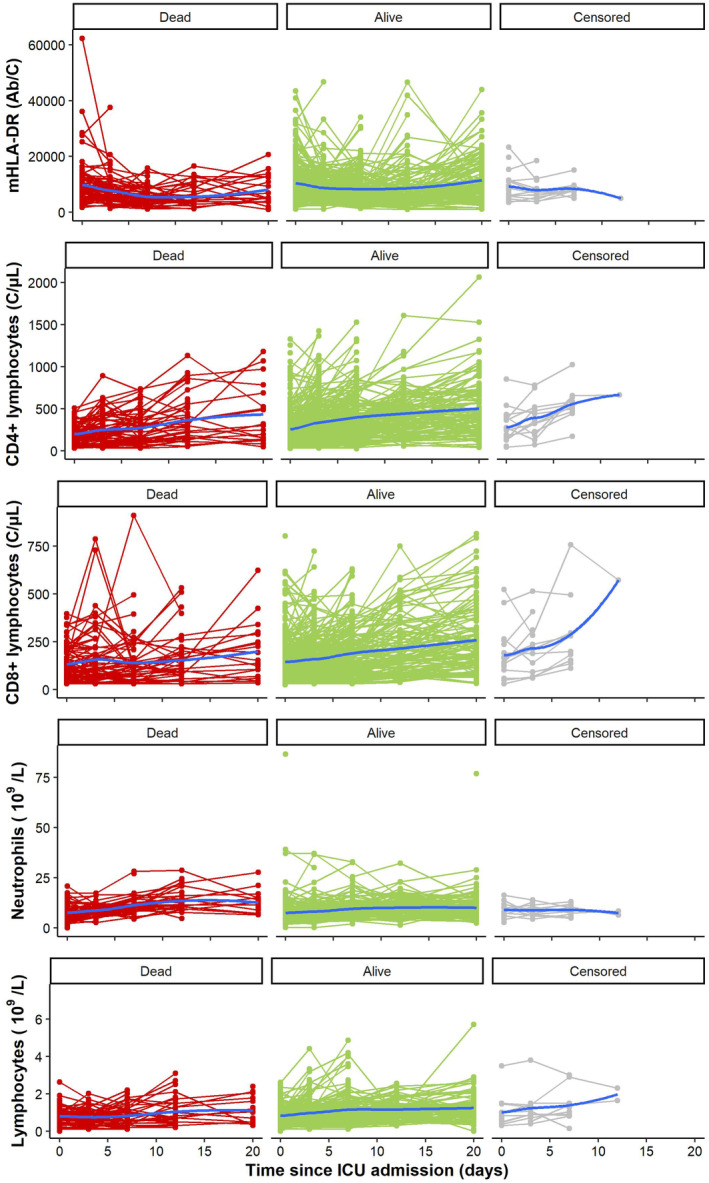
Spaghetti plots of mHLA‐DR, CD4+ lymphocytes, CD8+ lymphocytes, Neutrophils and lymphocytes according to vital status at Day 28 (D28). The blue curve represents the smoothed conditional mean at each time.

Spaghetti plots of mHLA‐DR, CD4+ lymphocytes, CD8+ lymphocytes, Neutrophils and lymphocytes according to vital status at Day 28 (D28). The blue curve represents the smoothed conditional mean at each time.