Figure 4.
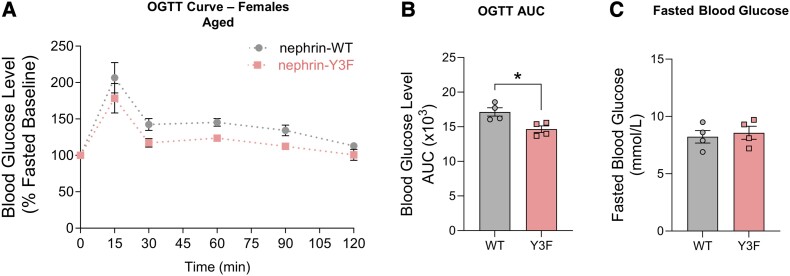
Improved glucose tolerance is observed in aged nephrin-Y3F mice. (A) OGTTs were performed at 16 months of age using 2 mg of D-glucose per gram of bodyweight on 6-hour-fasted female WT or nephrin-Y3F mice (n = 4). (B) AUC measurements for the respective OGTT curves in (A). (C) 6-hour fasting blood glucose concentrations on 16-month-old female WT or nephrin-Y3F mice (n = 4). Bars show mean ± SEM. Statistical significance was determined using Student's t-test. Significant difference is indicated as * for P < .05.
Abbreviations: AUC, area under the curve; OGTT, oral glucose tolerance test; WT, wild-type.

