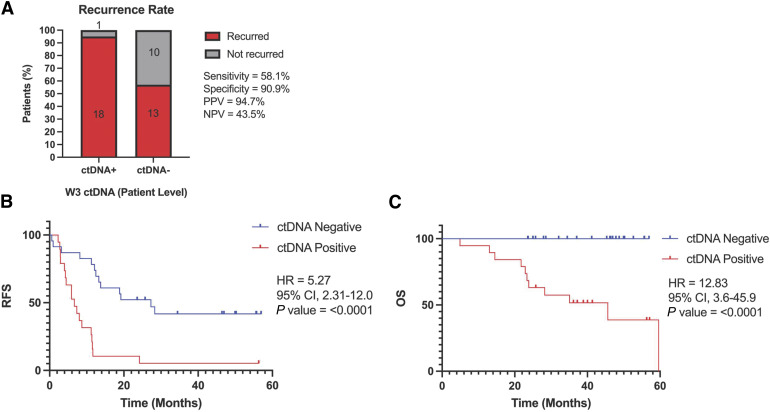
Figure 3.
Primary postprocedure ctDNA status predicts RFS and OS. A, Recurrence rate stratified by ctDNA status. Ninety-five percent CI as follows: sensitivity (40.8%–73.6%), specificity (62.3%–99.5%), PPV (75.4%–99.7%), and NPV (25.6%–63.2%). Kaplan–Meier curves at the primary time point stratified by ctDNA status (n = 42) for (B) RFS and (C) OS. CI, confidence interval.

