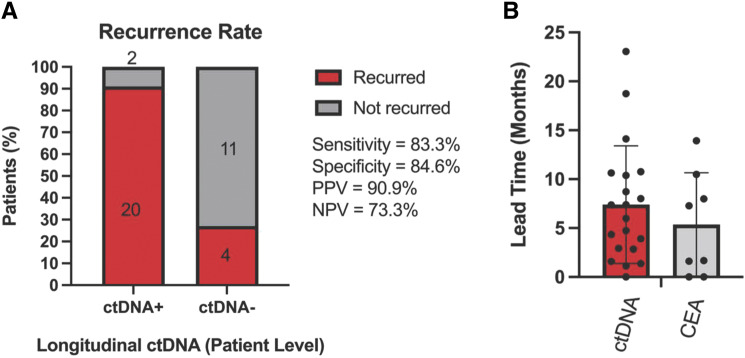
Figure 5.
Longitudinal ctDNA analysis improves sensitivity to detect relapse. A, Patient-level ctDNA status 95% CI as follows: sensitivity (64.2%–93.3%), specificity (57.8%–97.3%), PPV (72.2%–98.4%), and NPV (48.1%–89.1%). B, Lead time comparison of ctDNA vs. CEA as measured by disease recurrence measured by time to relapse (months; n = 20; P < 0.0001).

