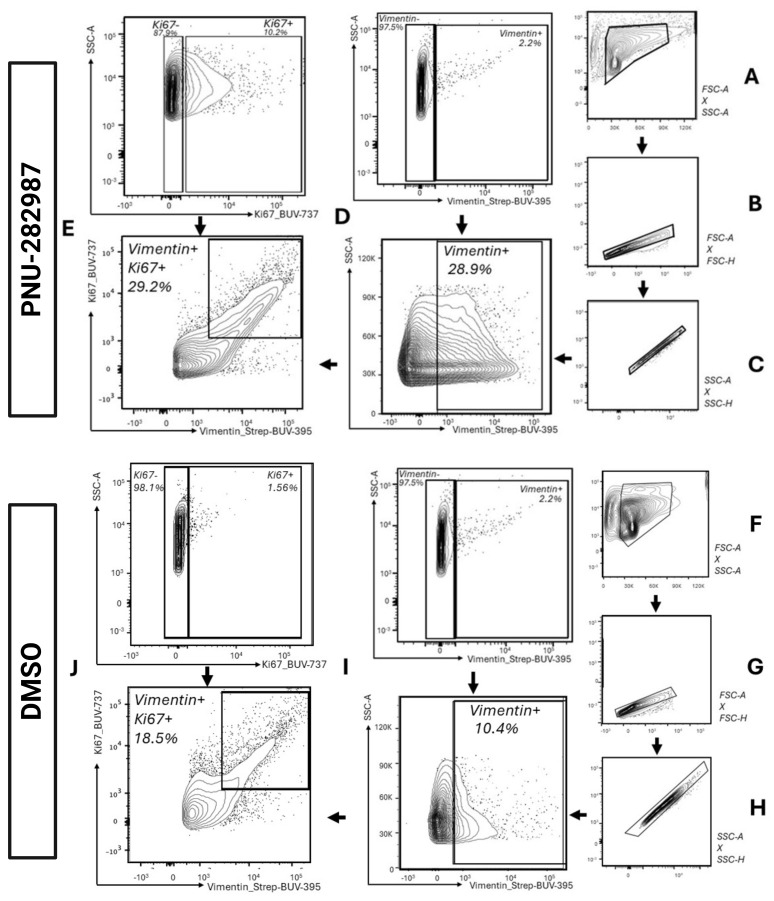
Figure 4. Representative gating strategy used for gating vimentin+ and Ki67+ cells after 28 days of DMSO and PNU-282987 treatment.
(A) and (F) A gate is made around the main cell population to exclude debris (SSC-A vs. FSC-A). (B–C) and (G–H) Singlet gates are drawn using FSC-H vs. FSC-A and SSC-H vs. SSC-A. (D) and (I) Vimentin+ cells are gated using FMOs to determine the cell population positive for vimentin (FSC-A vs. BUV-395-A). Back-gating figure for vimentin, displaying vimentin+ cells in the parent populations, is depicted in Figure S3. (E) and (J) Vimentin+ cells that are also labeled for the proliferation marker Ki67 are gated around. FMOs were utilized to determine positive cell populations (BUV-737-A vs. BUV-395-A).

