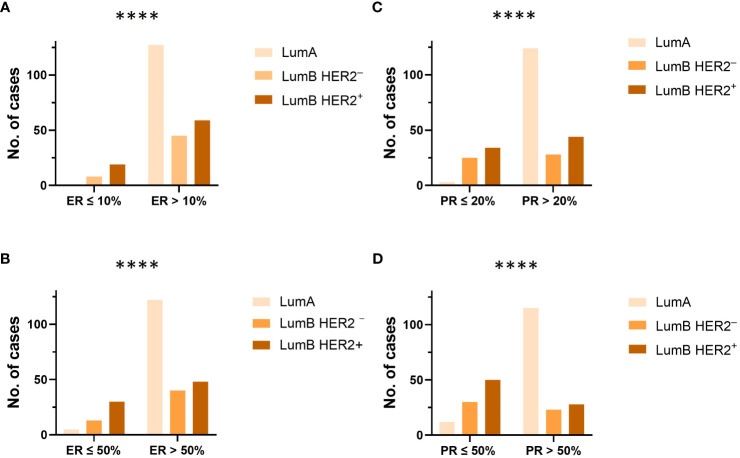
Figure 2.
(A, B) The proportion and distribution of ER at cutoff values of 10% and 50%, were compared between each luminal subtype (LumA, LumB HER2− and LumB HER2+), respectively. **** p-value < 0.0001, Chi-square test. (C, D) The proportion and distribution of PR at cutoff values of 20% and 50%, were compared between each luminal subtype (LumA, LumB HER2−, and LumB HER2+), respectively. **** p-value < 0.0001, Chi-square test.

