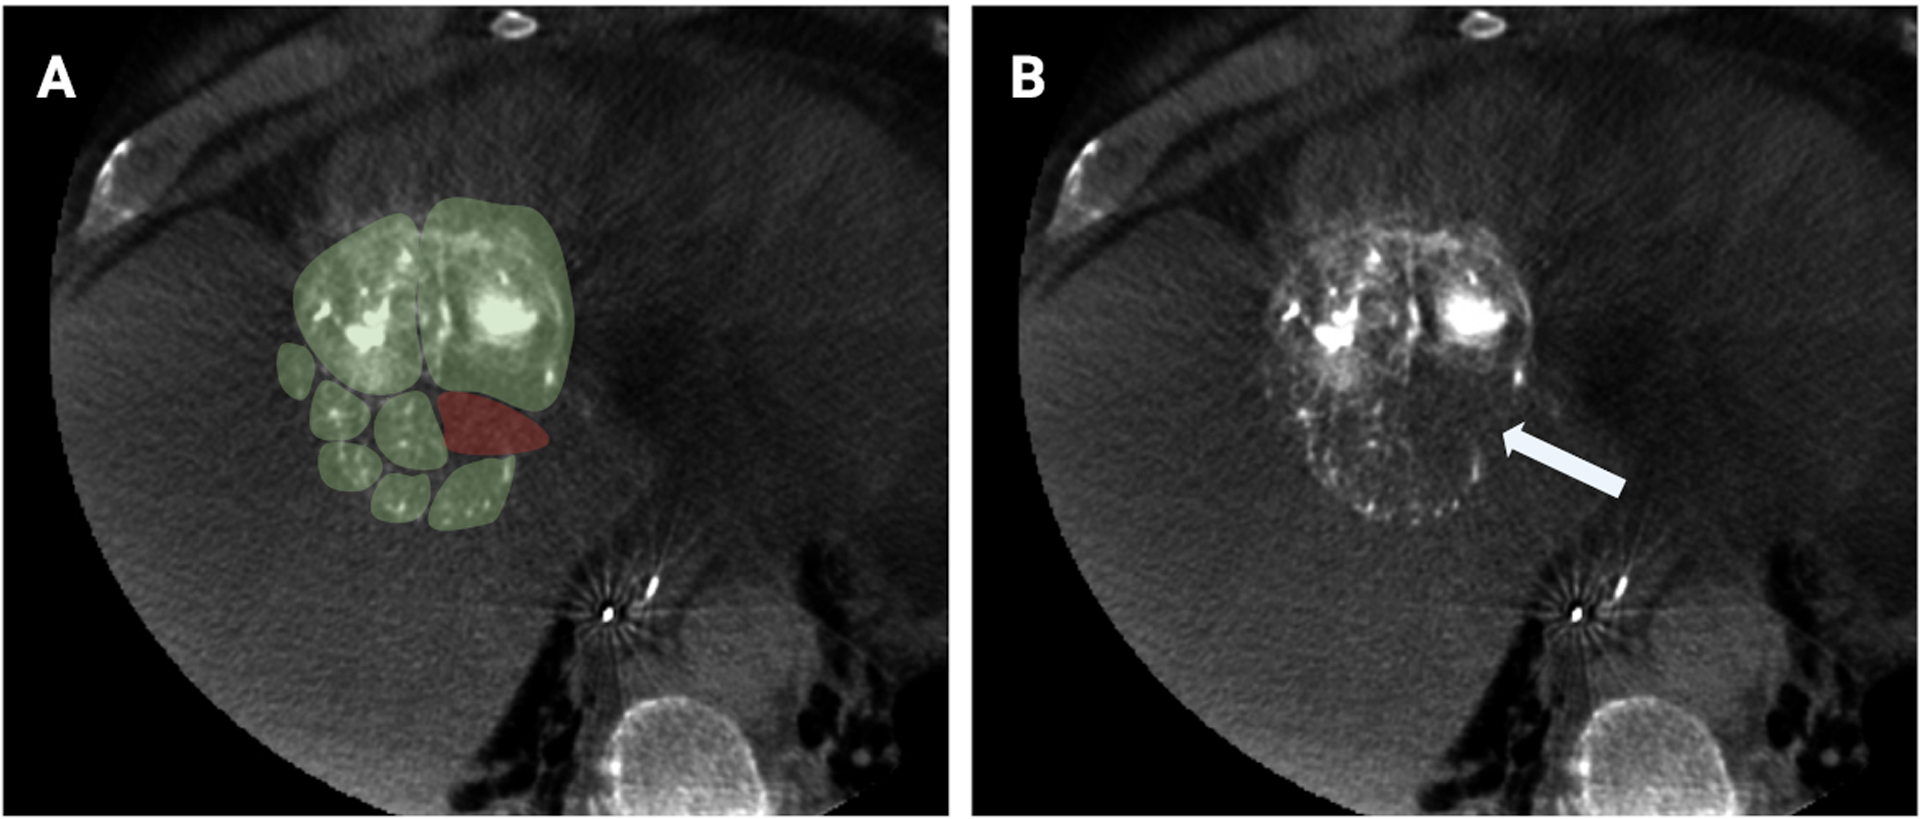
Figure 4.

Hypothetical representation of predictive models of spatial drug dosimetry based on radiopaque DEE microsphere attenuation and distribution in an HCC tumor. A) Axial CBCT slice of HCC tumor with green overlay representing hypothetical regions of tumor adequately treated with drug, and red overlay representing potentially undertreated regions. B) CBCT of same tumor showing a paucity of radiopaque DEE microspheres in the region that was illustrated as undertreated. More research is needed to transform this illustration into a method for quantitative prediction of drug distribution and therapeutic effects based on imaged distribution of radiopaque DEE microspheres.
