
Figure 6. DA increases myeloid cell numbers 2 DPW in diabetic mice.
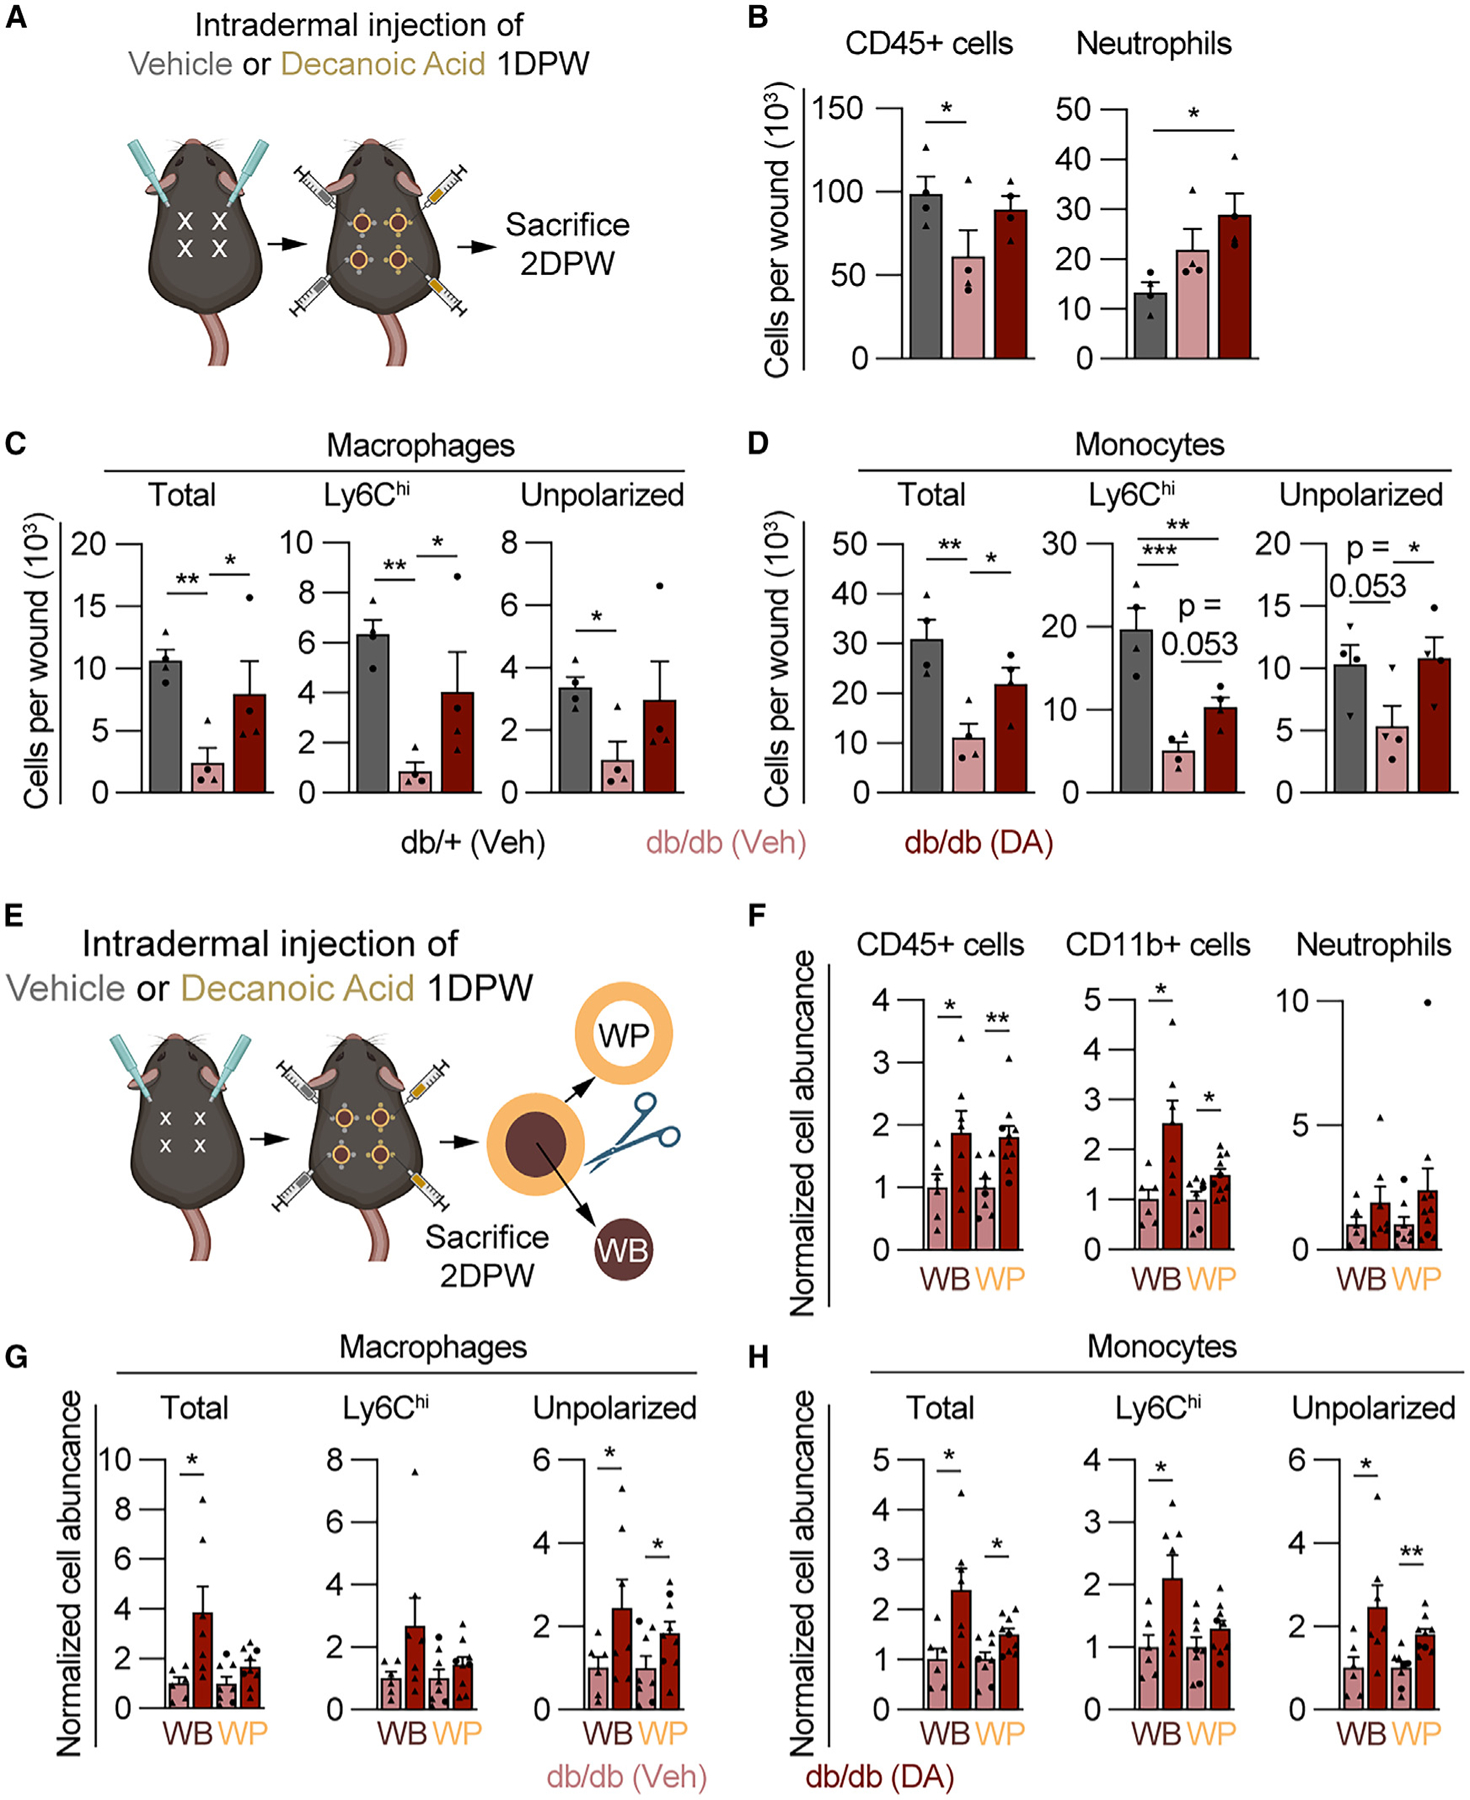
(A) Schematic showing the timeline for DA treatment and myeloid cell analysis.
(B–D) Quantification of flow cytometry for SYTOX− (B) CD45+ cells and neutrophils, (C) macrophages (total, Ly6Chi, and unpolarized), and (D) monocytes (total, Ly6Chi, and unpolarized) 2 DPW in db/+ mice treated with vehicle and db/db mice treated with vehicle or DA (n = 4 mice, circles denote males and triangles denote females). Significance was determined in (B)–(D) by one-way ANOVA corrected for multiple comparisons using the two-stage setup method of Benjamini, Krieger, and Yekutieli.
(E–H) Schematic showing the procedure for separation of WB from WP, for flow cytometry analysis of SYTOX− (F) CD45+ cells, myeloid cells (CD11b+), and neutrophils, (G) macrophage subsets, and (H) monocytes (n ≥ 9 wounds per condition, circles denote males and triangles denote females). Significance was determined by a two-tailed Student’s t test.
Error bars indicate mean ± SEM. *p < 0.05, **p < 0.01, and ***p < 0.001. M4, macrophage; DPW, days post-wounding; DA, decanoic acid.