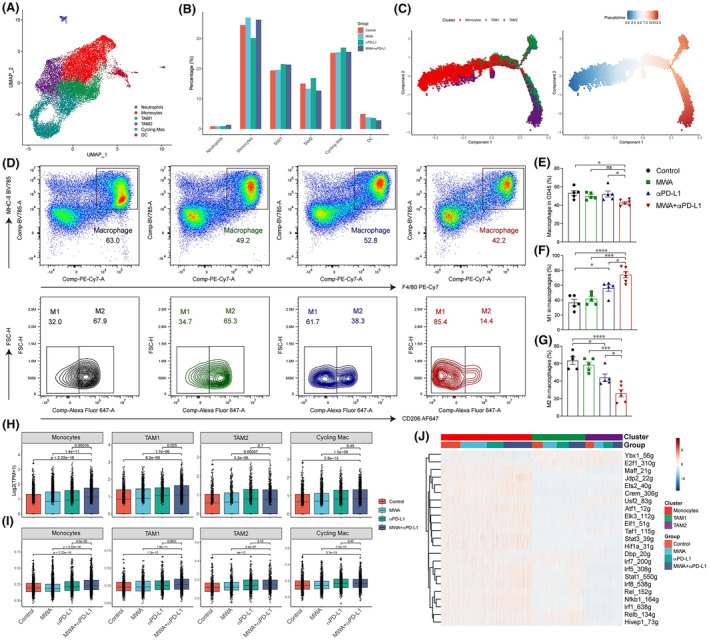
FIGURE 4.

Microwave ablation (MWA) combined with α programmed death ligand 1 (αPD‐L1) therapy promotes the infiltration and functions of macrophages. Tumor samples were analyzed by flow cytometry and single cell RNA sequencing on day 15 after MWA. (A) UMAP analysis revealed the classification of myeloid cells. (B) Bar plot showing the proportions of myeloid cells in (A). (C) Pseudotime analysis showing the developmental trajectory of monocytes, tumor‐associated macrophages 1 (TAM1), and TAM2 in MC38 tumors. TAM1 and TAM2 are discerned through their positive expression of Cd68 and Mrc1 (CD206) genes, respectively. (D) Representative flow cytometry plots are displayed. (E) Macrophages are quantified in terms of absolute cell numbers. (F) Absolute cell numbers of TAM1. (G) Absolute cell numbers of TAM2. (H) Boxplot showing expression of Cxcl9 in monocytes, TAM1, TAM2, and cycling macrophages in different treatment groups. (I) Boxplot showing scores of γ‐interferon (IFN‐γ) signaling in monocytes, TAM1, TAM2, and cycling macrophages in different treatment groups. (J) Heatmap showing the area under the curve of regulons' scores among monocytes, TAM1, and TAM2 in different treatment groups. One‐way ANOVA and Kruskal–Wallis multiple comparison tests were performed, and data are presented as mean ± SEM. *p < 0.05, **p < 0.01, ***p < 0.001, ****p < 0.0001.
