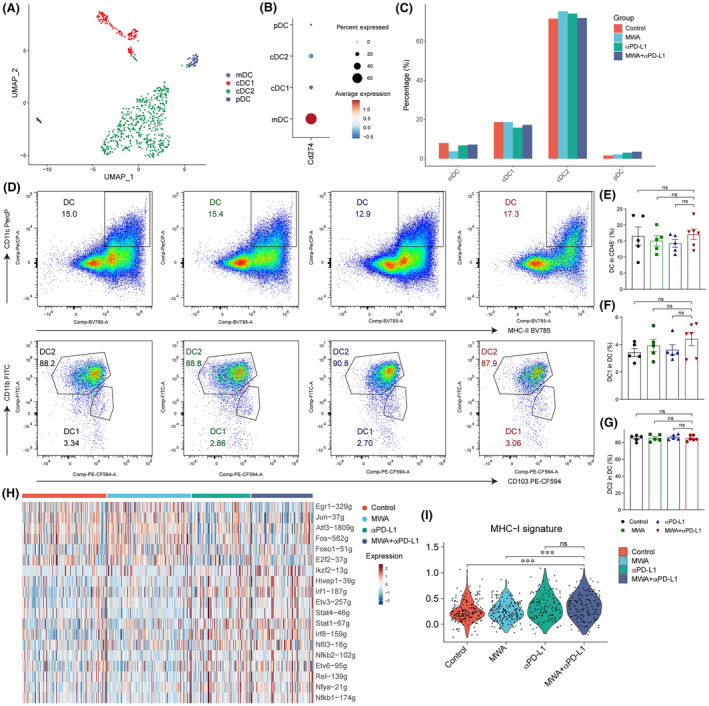
FIGURE 5.

Antigen presentation role of dendritic cells (DCs) was promoted in microwave ablation (MWA) plus α programmed death ligand 1 (αPD‐L1) therapy. Tumor samples were analyzed by flow cytometry and single cell RNA sequencing on day 15 after MWA. (A) The UMAP analysis revealed the classification of tumor‐infiltrating DCs into migratory DC (mDC) (Ccr7), DC1 (Clea9a, Xcr1), DC2 (Cd209a), and plasmacytoid DC (pDCs) (Siglech). (B) Dot plot showing Cd274 expression in different treatment groups. (C) Bar plot depicting the distribution of DCs among various treatment groups. (D) Representative flow cytometry plots. (E) Absolute cell numbers of DCs. (F) Absolute cell numbers of DC1. (G) Absolute cell numbers of DC2. (H) Heatmap showing the area under the curve of regulons' scores among DC cells from various treatment methods. (I) Violin plot showing the scores of MHC‐I molecules in different treatment groups. One‐way ANOVA and Kruskal–Wallis multiple comparison test were performed, and data are shown as mean ± SEM. ns, not significant.
