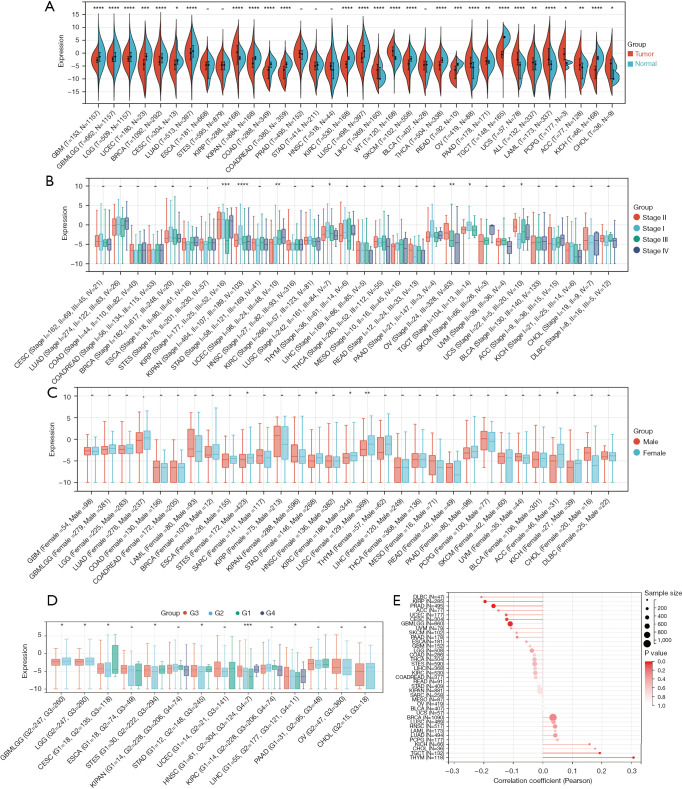
Figure 2.
Expression of SPAG6 in the clinical data. (A) The differential expression of SPAG6 in pan-cancer (red) and normal tissues (blue) downloaded from different databases. (B) The correlation between tumor stage and SPAG6 expression. Stage I = blue, stage II = red, stage III = green, and stage IV = purple. (C) The correlation between patients’ gender and SPAG6 expression. Male = red and female = blue. (D) The correlation between patients’ grade and SPAG6 expression. Grade 1 = green, grade 2 = blue, grade 3 = red, and grade 4 = purple. (E) The correlation between patients’ age and SPAG6 expression. –, no statistical significance; *, P<0.05; **, P<0.01; ***, P<0.001; ****, P<0.0001. G, grade.

