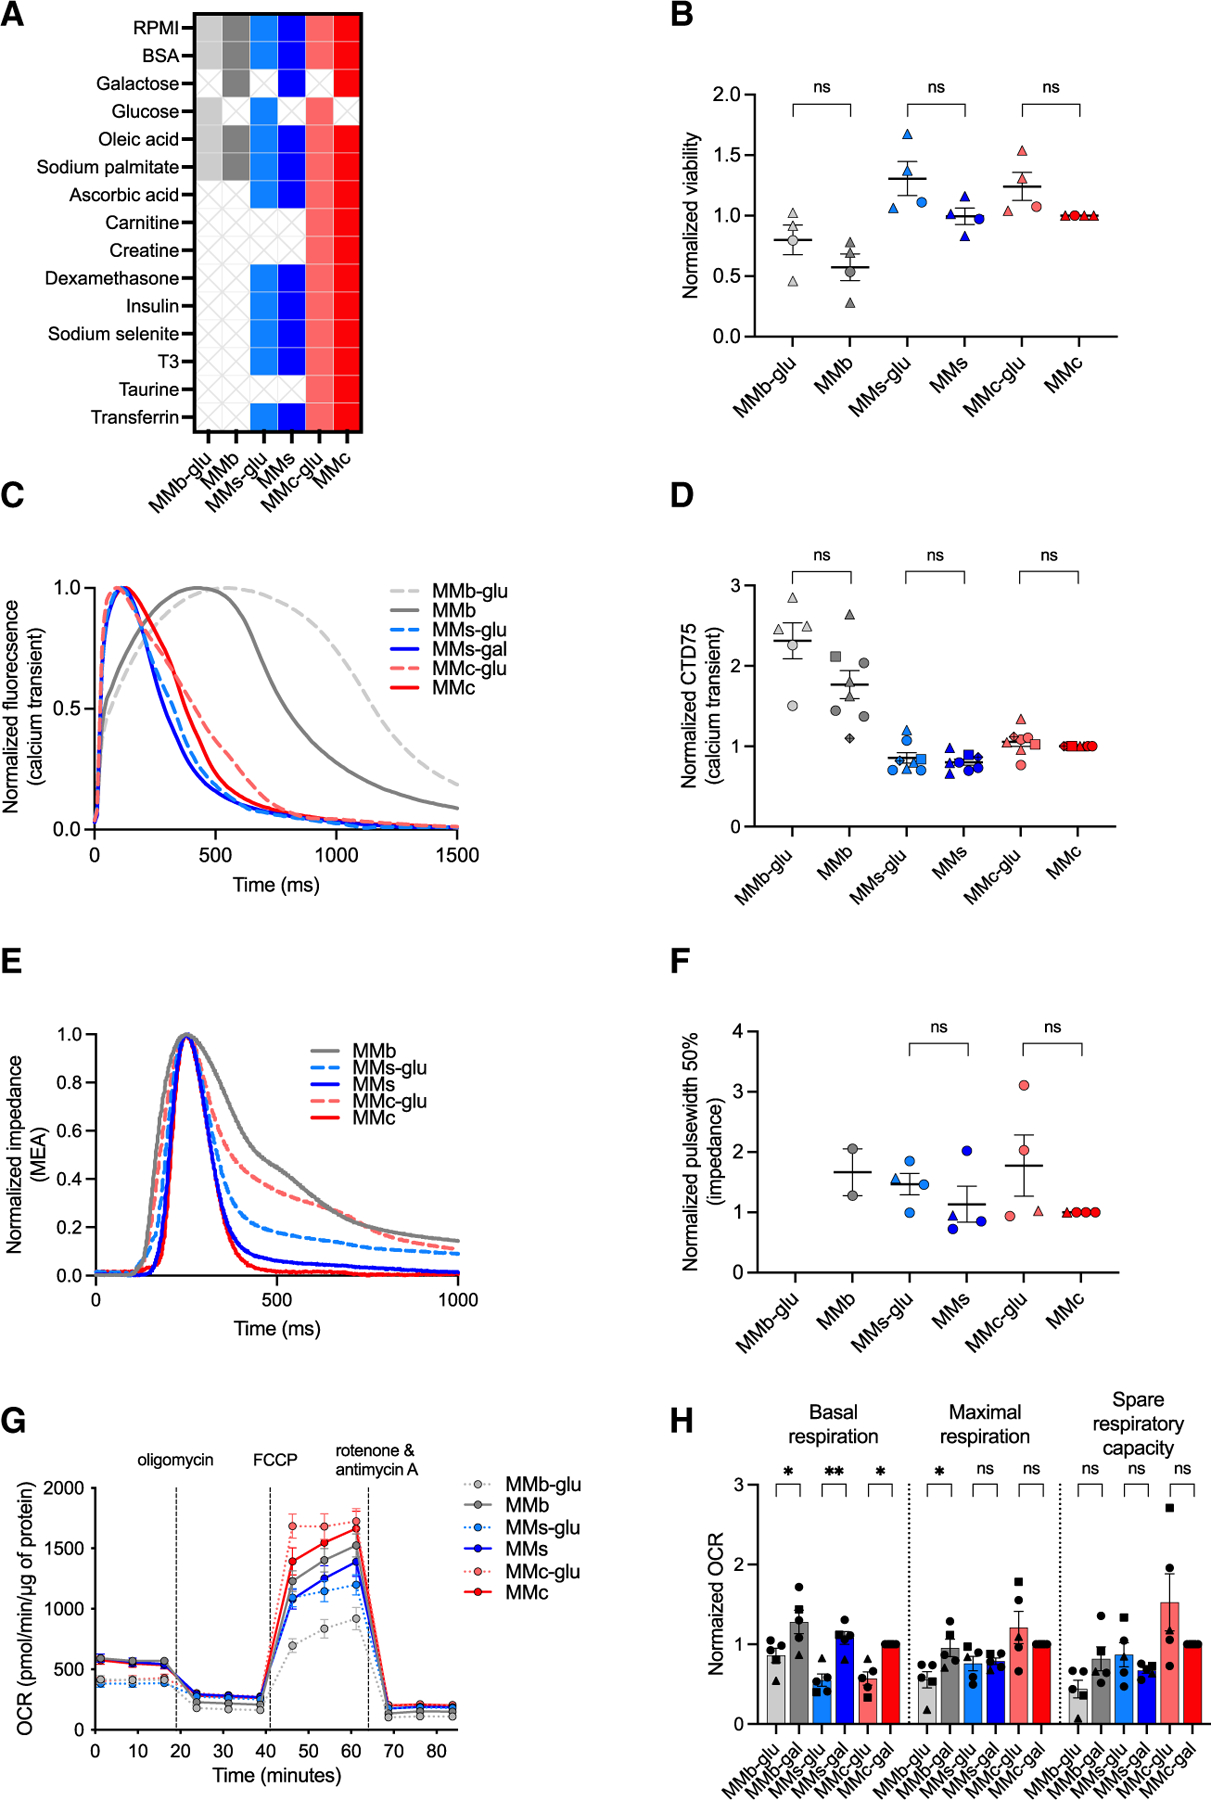
Figure 4. Galactose improves mitochondrial basal respiration.

(A) Glucose and galactose formulations of MMb, MMs, and MMc.
(B) Viability of hiPSC-CMs cultured in glucose or galactose formulations of MMb, MMs, or MMc from day 20 to day 33 (n = 4).
(C) Representative spontaneous Ca2+ transient recordings of hiPSC-CMs cultured in glucose or galactose formulations of MMb, MMs, or MMc from day 20 to day 35.
(D) CTD75 of hiPSC-CMs cultured in glucose or galactose formulations of MMb, MMs, or MMc (n = 8).
(E) Representative paced (0.8 Hz) impedance recordings of hiPSC-CMs cultured in glucose or galactose formulations of MMb, MMs, or MMc from day 20 to day 32.
(F) Pulse width at 50% measured from impedance recordings of paced (0.8 Hz) hiPSC-CMs cultured in glucose or galactose formulations of MMb, MMs, or MMc (n = 4).
(G) Mean OCR of hiPSC-CMs cultured in glucose or galactose formulations of MMb, MMs, or MMc from day 20 to day 33 (n = 5).
(H) Basal respiration, maximal respiration, and spare respiratory capacity of hiPSC-CMs cultured in glucose or galactose formulations of MMb, MMs, or MMc (n = 5).
Each data point shape indicates a different hiPSC line. Data are presented as mean ± SEM. n = experimental replicates, unpaired Student’s t test, *p ≤ 0.05, **p ≤ 0.01, ***p ≤ 0.005, ****p ≤ 0.0001. See also Figure S4.
