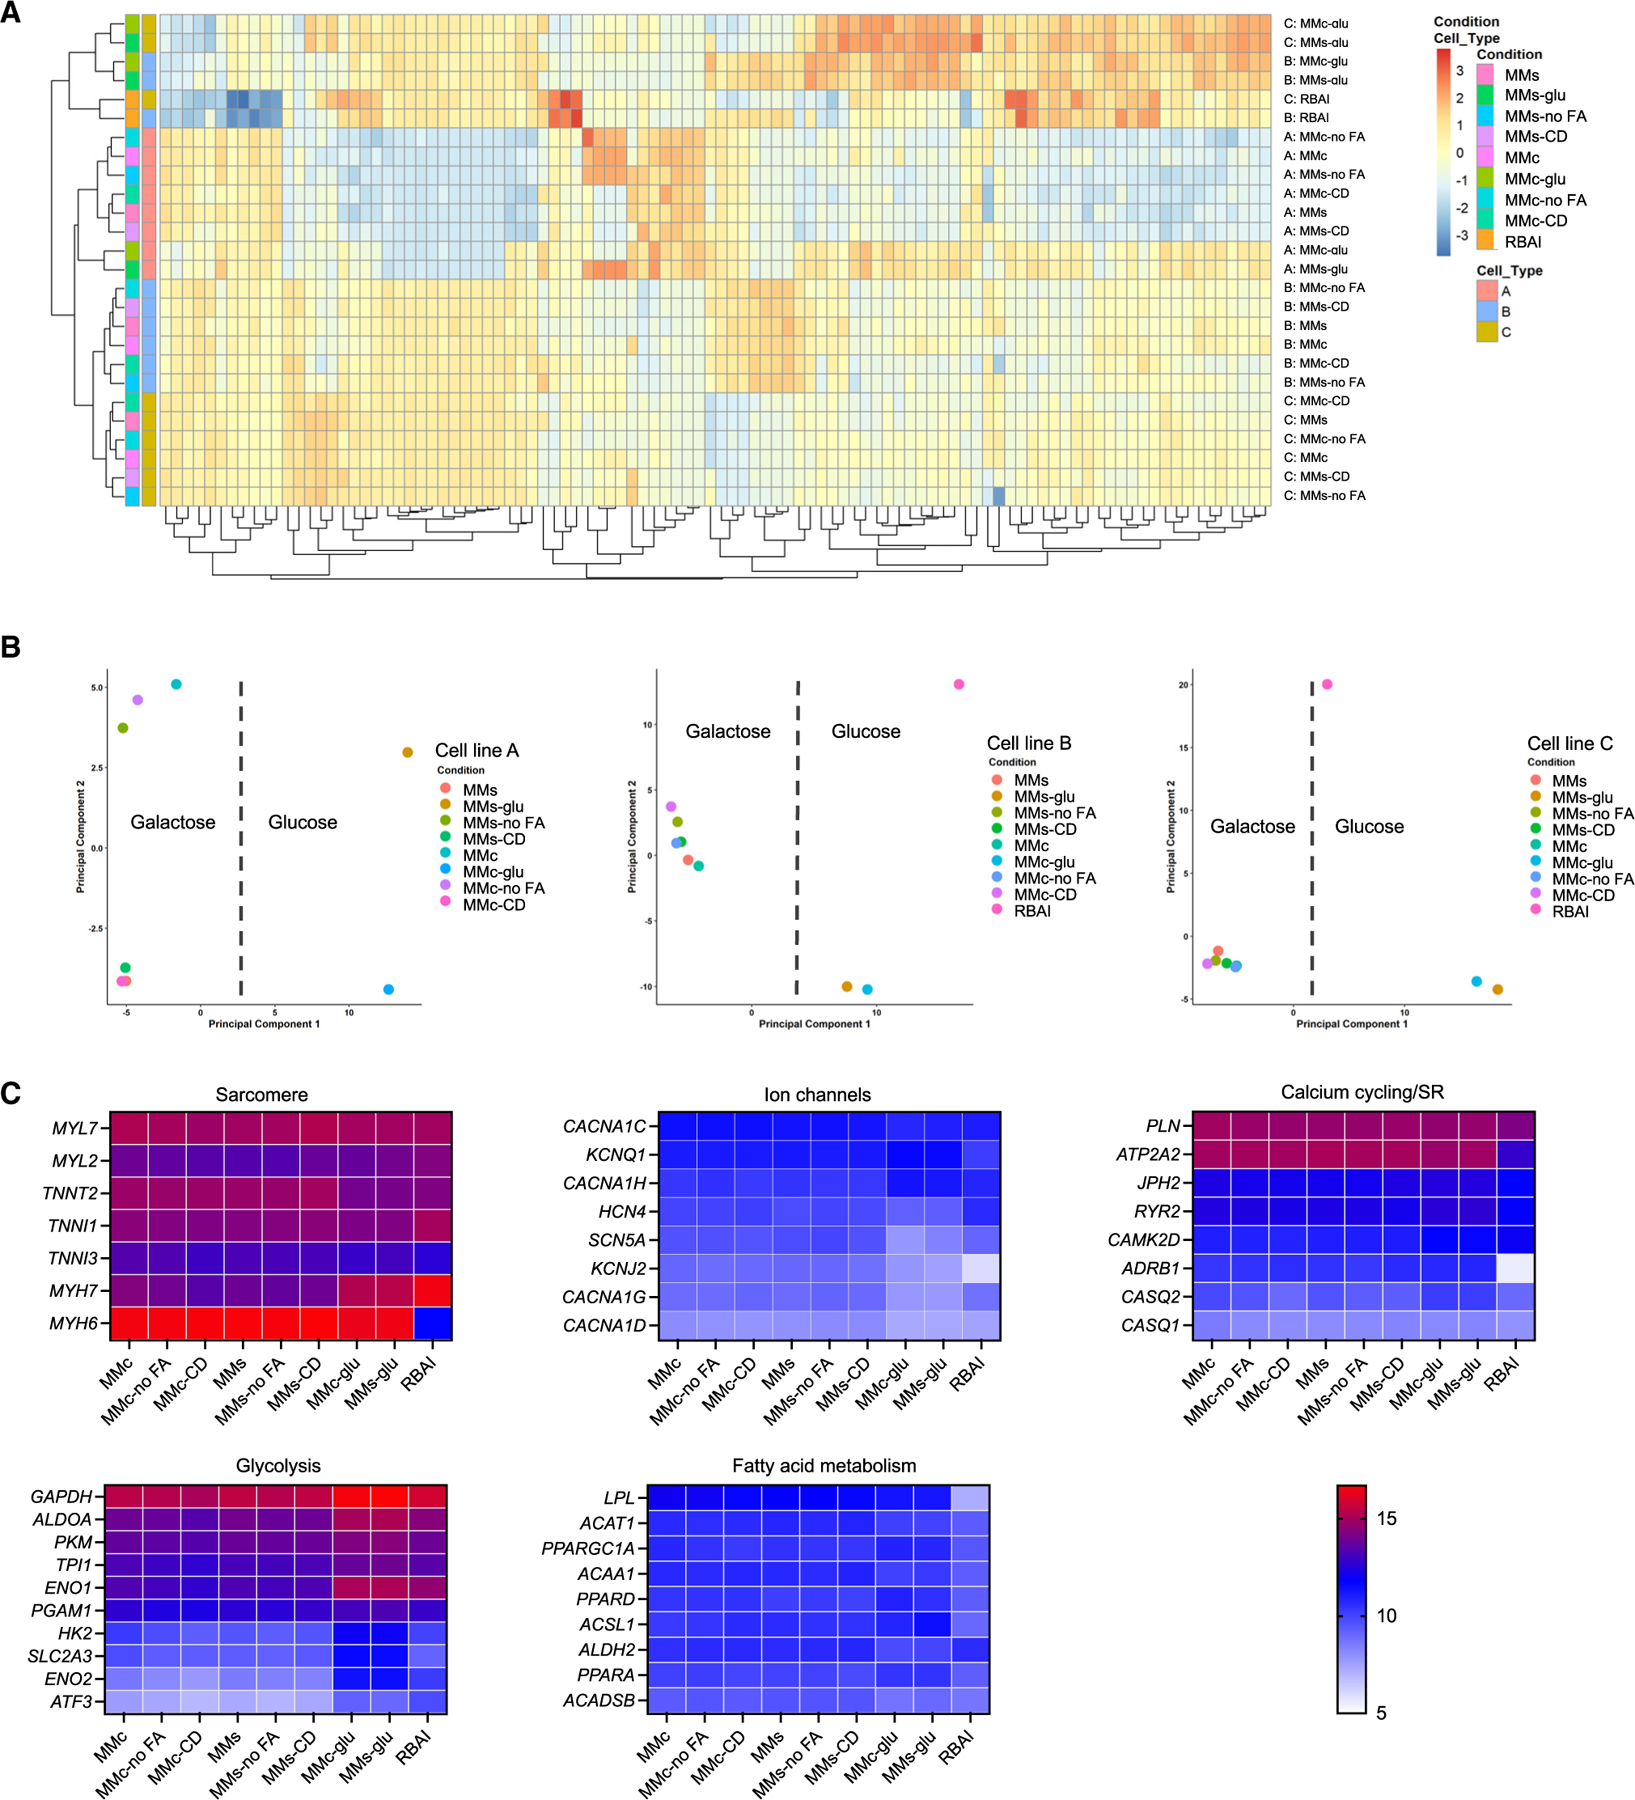
Figure 6. Energy substrate is key driver of hiPSC-CM transcriptomics.

(A) Heatmap of top 100 expressed genes for hiPSC-CMs generated from 3 different hiPSC lines and cultured in 9 different medium formulations from day 20 to day 33.
(B) Principal-component analysis (PCA) plots of hiPSC-CMs generated from 3 different hiPSC lines and cultured in 9 different medium formulations.
(C) Heatmaps of genes related to metabolism and cardiac structure and function.
See also Table S3.
