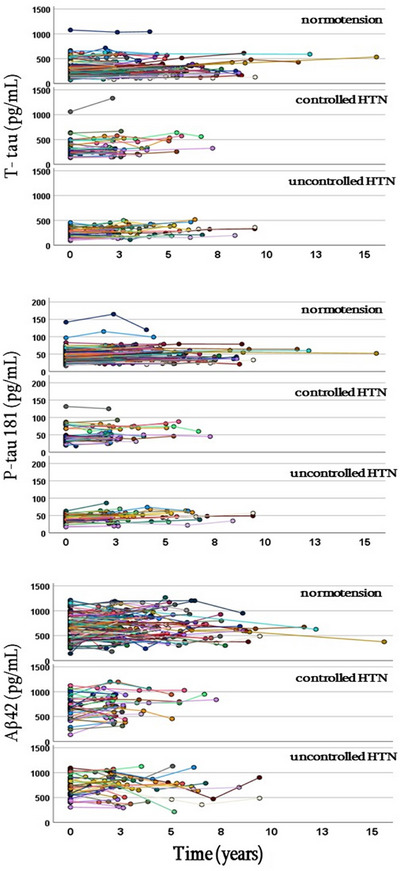
FIGURE 3.

Individual trajectories of T‐tau (total tau), P‐tau 181 (phosphorylated tau), and Aβ42 (amyloid beta 42) over course of study in each of three study subgroups.

Individual trajectories of T‐tau (total tau), P‐tau 181 (phosphorylated tau), and Aβ42 (amyloid beta 42) over course of study in each of three study subgroups.