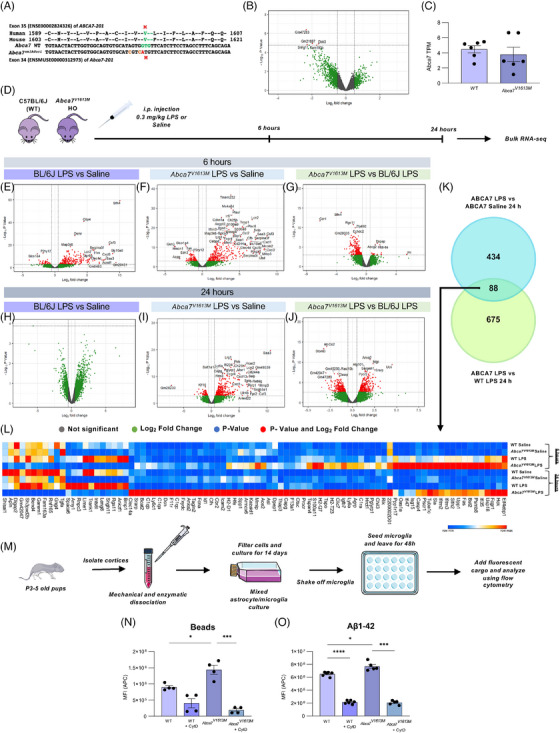
FIGURE 1.

The Abca7V1613M allele in mice models the human single nucleotide polymorphism rs117187003 (ABCA7 V1599M ) and induces distinct responses to lipopolysaccharide (LPS) challenge and increased phagocytosis. (A) Human and mouse amino acid sequence alignment indicating position of valine (V) to methionine (M) missense variant in each species (in green/red). Two silent mutations (tan) were co‐introduced into mouse Abca7 to prevent recutting of the edited allele by CRISPR‐Cas9. (B) Volcano plot of differentially expressed genes (DEGs) between C57BL6/J (wildtype [WT]) and Abca7V1613M homozygous mice at 6 to 8 months of age. Only five DEGs were deemed significant (denoted by red dots). (C) Transcripts per million (TPMs) of Abca7 in WT and Abca7V1613M homozygotes (unpaired Student t‐test). (D) Experimental paradigm used for the LPS experiment. I Volcano plot of DEGs between WT mice treated with 0.3 mg/kg LPS versus saline 6 hours postinjection. (F) Volcano plot of DEGs between Abca7V1613M mice treated with 0.3 mg/kg LPS versus saline 6 hours postinjection. (G) Volcano plot of DEGs between Abca7V1613M and WT B6/J mice treated with 0.3 mg/kg LPS 6 hours postinjection. (H) Volcano plot of DEGs between Abca7V1613M mice treated with 0.3 mg/kg LPS versus saline 24 hours postinjection. (I) Volcano plot of DEGs between Abca7V1613M mice treated with 0.3 mg/kg LPS versus saline 24 hours postinjection. (J) Volcano plot of DEGs between Abca7V1613M and WT mice treated with 0.3 mg/kg LPS 24 hours post injection. (K) Venn diagram highlighting the 88 overlapping genes between Abca7V1613M LPS versus Abca7V1613M saline and Abca7V1613M LPS versus WT LPS DEGs at 24 hours. (L) Heatmap of 88 overlapping genes between Abca7V1613M LPS versus saline mice and Abca7V1613M and WT LPS treated mice 24 hours postinjection highlighting increased expression of inflammatory genes in Abca7 V1613M mice compared to WT mice at both 6 and 24 hours postinjection. N = 3 to 4 mice per genotype/treatment/timepoint. Mice from each genotype/treatment/timepoint were pooled and the mean TPM value was plotted as the heatmap. A log2 fold change of 0.5 was used for all volcano plots; however, the ‐log10 p‐value changed according to different comparisons analyzed. (M) Schematic of primary microglial extraction from neonatal pups. (N,O) Uptake assays of primary microglia extracted from WT and Abca7V1613M mice for (N) carboxylated beads, N = 4 independent experiments, and (O) Aβ 1‐42 peptide, N = 5 independent experiments; one‐way analysis of variance was used to examine group differences. MFI (APC) indicates the mean fluorescence intensity of allophycocyanin (APC) fluorophore inside microglia; 10 μM cytochalasin D was used as an inhibitor for phagocytosis. Data are represented as mean ± SEM. *p ≤ 0.05, ***p ≤ 0.001, ****p ≤ 0.0001.
