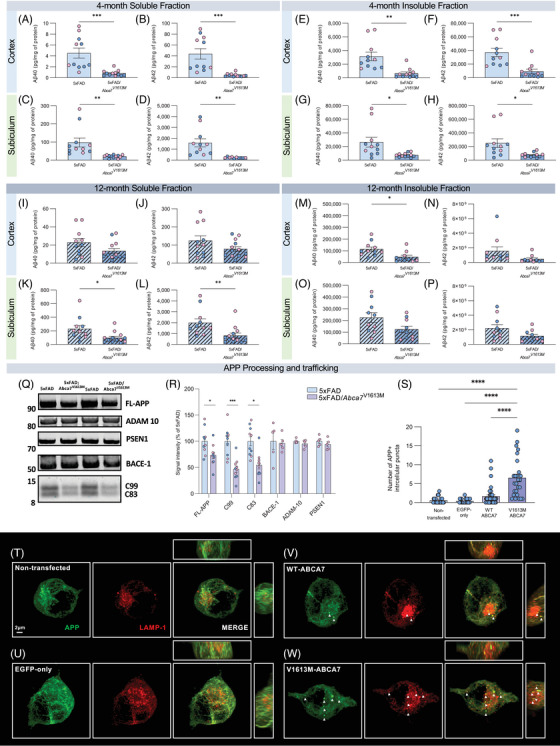
FIGURE 6.

Abca7V1613M variant reduces amyloid beta (Aβ) production and processing in vivo and alters amyloid precursor protein (APP) trafficking in vitro. (A‐P) Quantification of Aβ40 and Aβ42 in detergent insoluble and soluble fractions in 5xFAD and 5XFAD/Abca7V1613M hippocampus and cortex in (A‐H) 4 month‐old and (I‐P) 12‐month‐old mice. In 4‐month‐old mice, both Aβ40 and Aβ42 are reduced in all samples. At 12‐months‐old, soluble Aβ40 and Aβ42 are reduced in subiculum and insoluble Aβ40 is reduced in cortex, with both soluble and insoluble Aβ40 and Aβ42 trending lower in other samples from 5xFAD/Abca7V1613M animals compared to 5xFAD mice. (Q) Western blot of soluble cortical protein from representative female 5xFAD and 5XFAD/Abca7V1613M mice at 4 months for full‐length APP (FL‐APP), APP C‐terminal fragments (C99 and C83), BACE‐1, ADAM‐10, PSEN1, and C‐terminal PSEN1 fragment. (R) Quantification of FL‐APP, C99 and C83, BACE‐1, ADAM‐10, and PSEN1 normalized to total protein stain (TPS) as a percentage of 5xFAD signal intensity. (S) Quantification of intracellular APP+ puncta in transfected N2a cells. (T‐W) Representative confocal images showing 22C11 (APP) and LAMP1 staining in (T) nontransfected control, (U) EGFP‐only (empty vector) control, (V) Wildtype (WT)‐ABCA7 overexpressing, and (W) V1613M‐ABCA7 overexpressing N2a cells. Scale bar = 2 microns. N = 4 to 6 per sex/genotype/age (A‐R); N = 26 to 36 cells per group (S). Data are represented as mean ± SEM. Statistics (A‐P) by unpaired Student t‐test, (R) by individual unpaired Student t‐test of each target protein, (S) by one‐way analysis of variance. *p ≤ 0.05, **p ≤ 0.01, ***p ≤ 0.001, **** p ≤ 0.0001.
