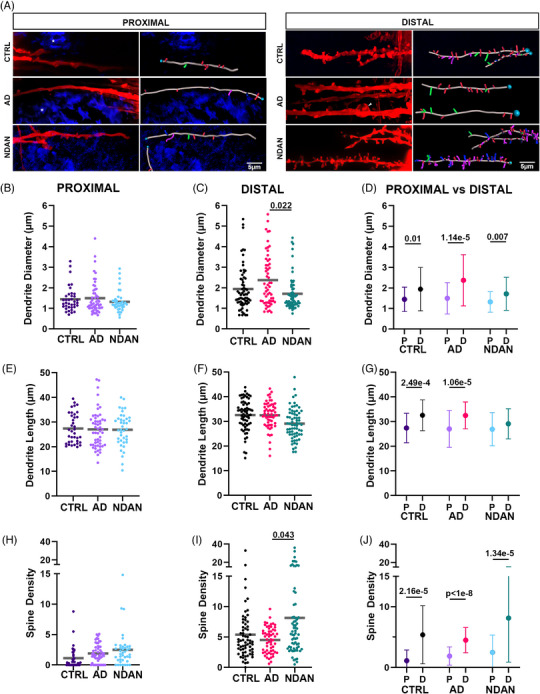
FIGURE 2.

Quantitative analysis of dendrite diameter, length, and total spine density. Proximal (A) and distal (B) dendrites and their dendritic spines shown in red. A white asterisk highlights an amyloid plaque. An arrowhead points to a bulbous dilation of a dendrite observed in the frontal cortex of an AD post mortem brain sample. The respective right columns present reconstructed 3D images of the dendritic spines and dendrites, based on the images in the left columns. Turquoise circles indicate the starting points of each quantified dendrite. Stick‐like shapes are color coded: red for stubby spines, green for mushroom spines, blue for long thin spines, magenta for filopodia. No significant differences were identified in the Aβ plaque proximity: dendrite diameter (B), length (E), or total spine density (H) among CTRL, AD, and NDAN. (C) In the distal area, AD individuals showed larger dendrite diameter compared to NDAN. The dendrite length (F) in the distal area was not different among the groups. (I) Total spine density was higher in NDAN compared to AD, in the distal area. When comparing the proximal area to the distal area, the dendrite diameter (D), length (G), and total spine density (J) in the distal area exceeded those in the proximal area for all groups, except for the dendrite length of NDAN. For statistical tests, we used a mixed‐effects ANOVA model with a random intercept for the individuals. Donor information described in Table 1A.
