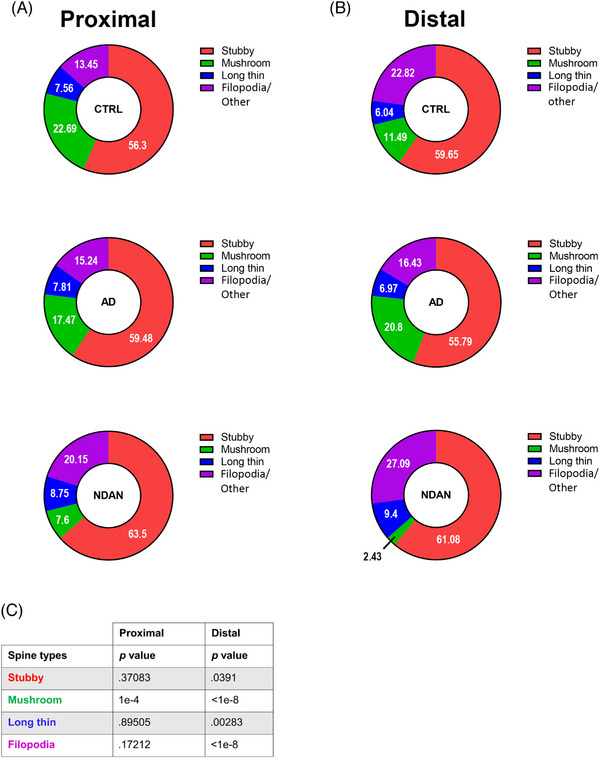
FIGURE 4.

Percentage of spine subtypes relative to Aβ plaques. Donut diagrams showing CTRL, AD, and NDAN spine subtype relative abundances expressed in percentages, in proximal (A) and in distal (B) areas. Spine subtypes are color coded: red for stubby spines, magenta for filopodia spines, blue for long thin spines, and green for mushroom spines. In the distal area, the densities of stubby, mushroom, long thin, and filopodia spines differ significantly between CTRL, AD, and NDAN. In contrast, in the proximal area, the spine densities of all types, except for the mushroom spines, did not show significant differences (see p values in (C). For statistical analysis, a chi‐squared test was used to determine whether the percentage spines differed between diagnoses (C). Donor information is presented in Table 1A.
