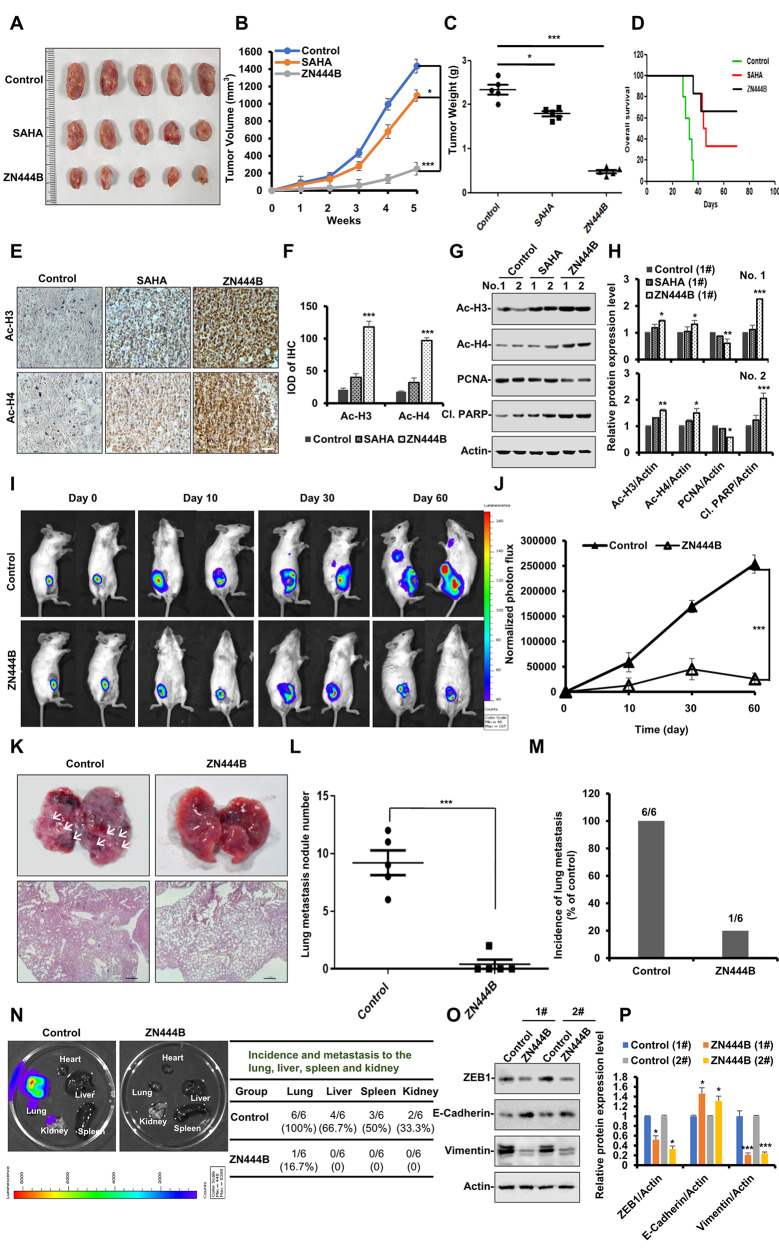
Fig. 3.
ZN444B inhibits breast tumor growth and metastasis in vivo. A 4T1 cells (1 × 10⁵) were injected into the mammary fat pad of female BALB/c mice, and mice were allocated to 3 groups (n = 5 per group), 7 days after tumor-cell implantation. After 35 days, all mice were sacrificed. Representative images of the primary tumors removed from mice after administration of ZN444B or SAHA for 28 days. B Primary tumor volume was measured each week (* p < 0.05, *** p < 0.001). C Primary tumor weight in each group was measured (* p < 0.05, *** p < 0.001). D Overall survival rate in the 4T1 breast tumor animal model. E Primary tumors were fixed and paraffin embedded. Five-micrometer (5 μm) sections were analyzed by IHC using an anti-Ac-H3 and Ac-H4 antibodies (scale bar, 100 μm). F The IHC results were analyzed by Image-Pro Plus 6.0 (n = 5 fields of view). G Primary tumors were lysed and applied to immunoblots using the indicated antibodies, with actin as a loading control. Acetylated histone H3/H4 protein levels and the expression of PCNA and Cleaved-PARP in primary tumor tissue were detected using western blot analysis. H The statistical result of (G). All data are shown as mean ± SD, two-way ANOVA, *p < 0.05, **p < 0.01, ***p < 0.001. I 4T1-Luc cells were injected into the 4th mammary fat pad of female BALB/c mice, resulting in a primary breast tumour. Mice were divided into 2 groups (n = 5 per group) on day 7. Real-time images on treatment day 0, day 10, day 30 and day 60 were acquired using the Xenogen IVIS. J Quantification of bioluminescence. Data shown are mean ± SD. *** p < 0.001. K-M Metastatic lung nodules were visualized and then counted manually, and differences were evaluated with Student’s t test; *** p < 0.001. N Ex vivo bioluminescence images were obtained in each group to determine the effects of ZN444B against distant metastasis. Metastasis incidence in distant organ was quantified. O Primary tumors were lysed and applied to immunoblotting with the indicated antibodies. Actin was used as a loading control. P The statistical result of (O). All data are shown as mean ± SD, two-way ANOVA, *p < 0.05, **p < 0.01, ***p < 0.001

