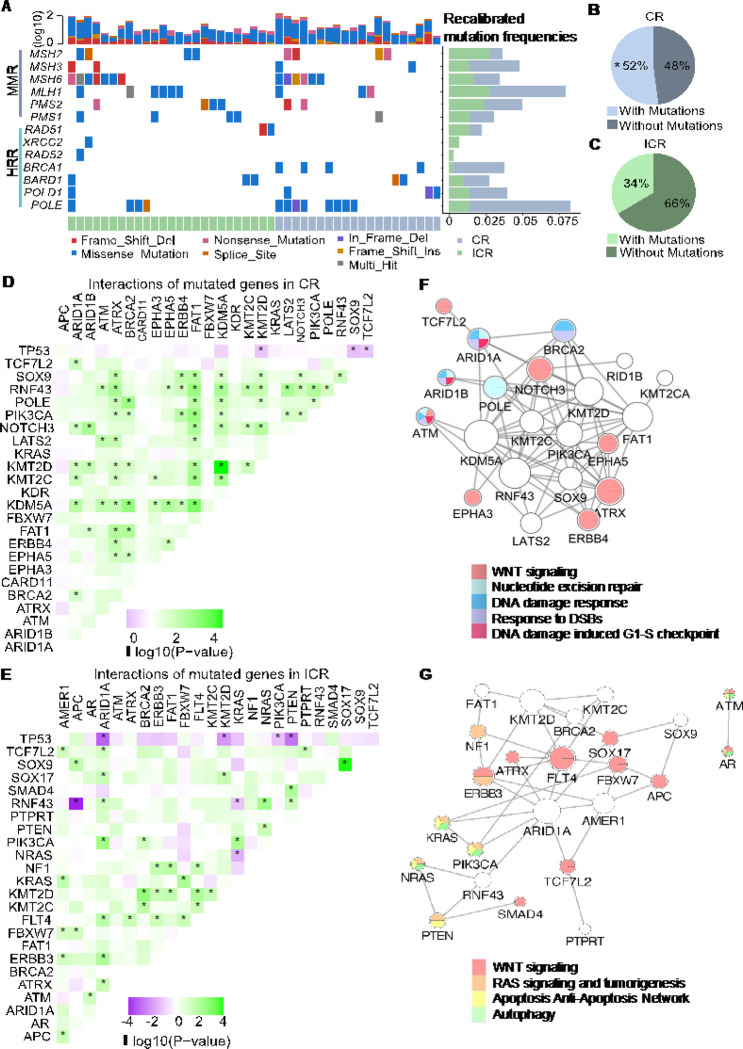
Figure 3. Genomic determinants of response to nCRT.
A: Oncoplot illustrating mutations in DNA repair-related genes. MMR: DNA mismatch repair. HRR: Homologous recombination repair. The top bar plot quantifies mutation frequency on a log10 scale for each patient. The side bar plot recalibrates mutation frequencies across individual genes, with a sample size of 364 (CR=104, ICR=260). B, C: Pie charts representing the distribution of patients with and without mutations in DNA repair-related genes for complete responders (CR) (B) and incomplete responders (ICR) (C). In CR patients, 52% exhibited mutations (* indicates statistical significance, Chi-squared test, p = 0.002), while in ICR patients, 34% had mutations. D, E: Diagrams depicting interactions between frequently mutated genes in CR tumors (D) and ICR tumors (E), with green indicating co-occurring mutations and purple showing mutually exclusive mutations. Significant interactions determined by Fisher’s exact test are marked with stars (p<0.05). F, G: Networks of co-occurring mutated genes in CR tumors (F) and ICR tumors (G).

