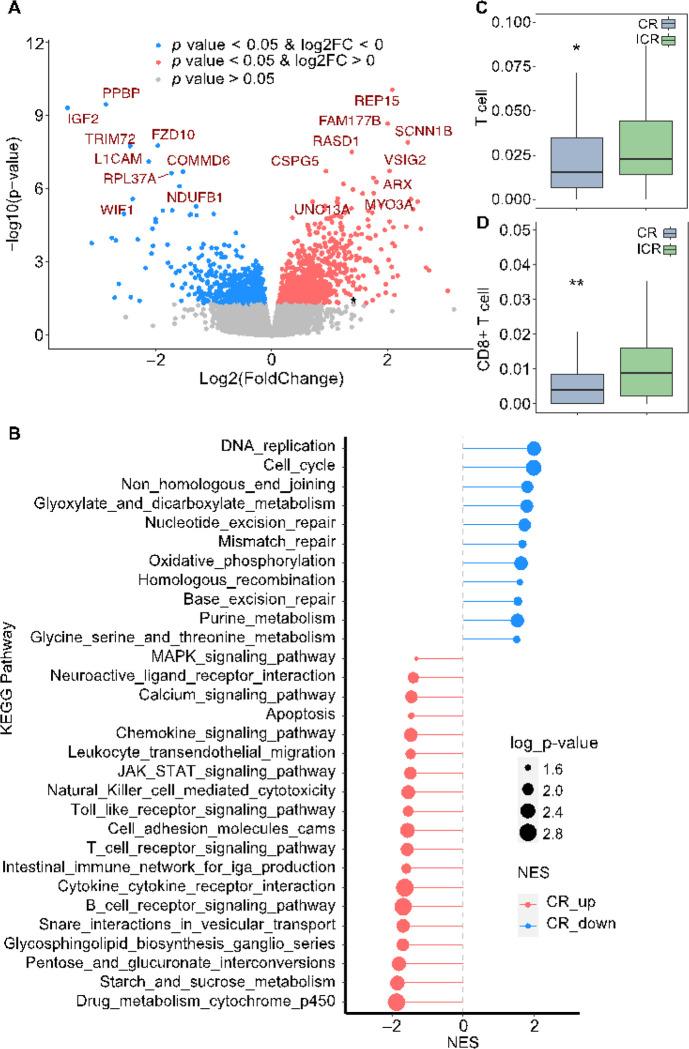
Figure 4. Differences in transcriptomic profile and immune cell infiltration between CR and ICR to nCRT.
A: Volcano plot displaying differentially expressed genes (DEGs) between complete responders (CR) and incomplete responders (ICR). Genes with p < 0.05 and increased expression are shown in red, decreased expression in blue, and non-significant changes in gray. B: Pathway Enrichment Analysis. The chart displays significantly enriched KEGG pathways based on differentially expressed genes (DEGs) in complete responders (CR). Pathways more active in CR are indicated in blue (CR down) and those less active in red (CR up). The size of the dot correlates with the −log10 p-value, indicating the statistical significance of the enrichment. C, D: Box plots comparing the infiltration levels of T cells (C) and CD8+ T cells (D) within tumor microenvironments between CR (n=36) and ICR (n=86) groups. Statistical significance was determined using the Mann-Whitney U test, with * indicating p < 0.05 and ** indicating p < 0.01.

