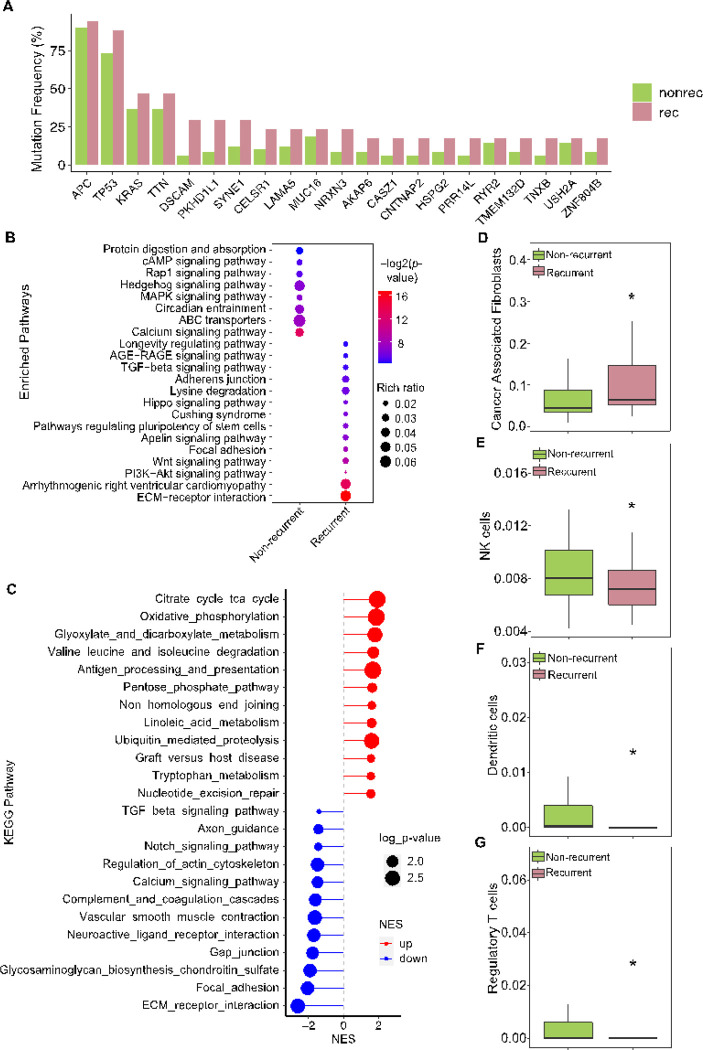
Figure 5. Genomic and immune landscape differences associated with recurrence in incomplete responders to nCRT.
A: Bar plot displaying the frequency of mutations in genes for ICR tumors, differentiating between recurrent (rec, n=17) and non-recurrent (nonrec, n=49) cases. B: Enrichment analysis of KEGG pathways comparing frequently mutated genes in recurrent versus non-recurrent ICR tumors, with pathway significance denoted by color intensity and dot size representing the rich ratio. C: Enrichment plot illustrating the significantly enriched pathways for differentially expressed genes (DEGs) between recurrent and non-recurrent ICR tumors, with upregulated pathways in red and downregulated in blue. D-G: Box plots quantifying the relative abundance of cancer-associated fibroblasts (D), NK cells (E), dendritic cells (F), and regulatory T cells (G) in recurrent (n=23) compared to non-recurrent ICR tumors (n=53). Statistical significance determined by Mann-Whitney U test, with * indicating p < 0.05.

