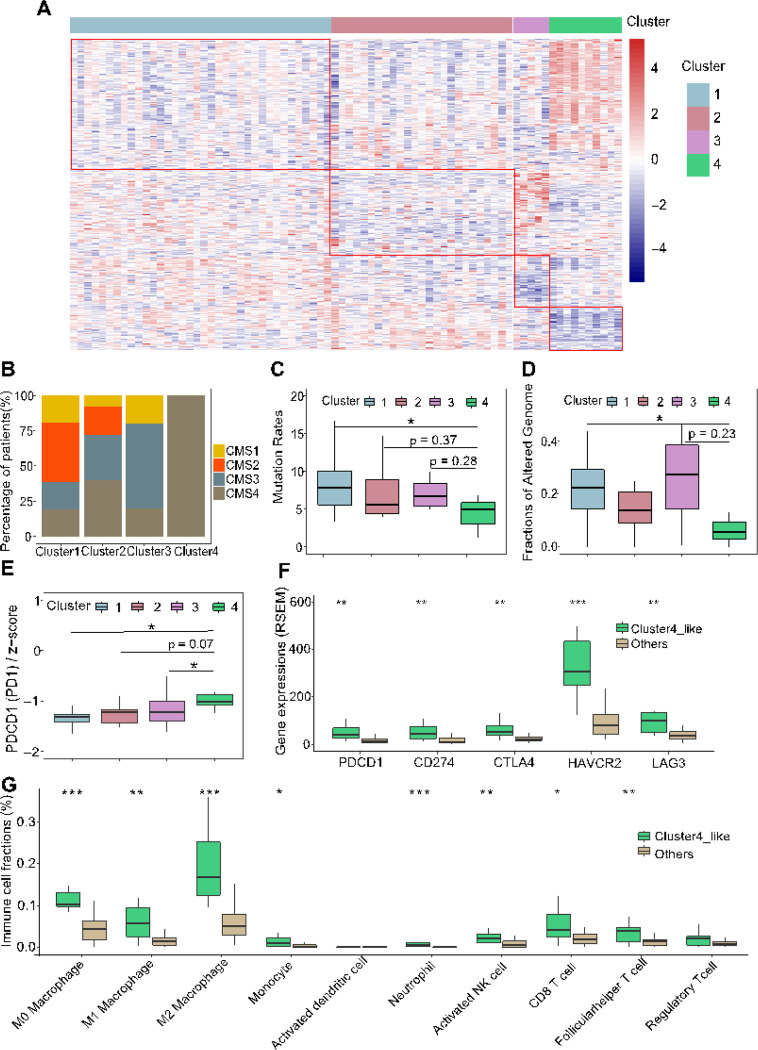
Figure 6. Gene expression profiling reveals an immune-active tumor subtype in incomplete responders associated with increased resistance and pooper prognosis post-neoadjuvant therapy.
A: Heatmap showing distinct gene expression profiles across four identified subgroups of ICR tumors (n=76; Cluster1: n=36, Cluster2: n=25, Cluster3: n=5, Cluster4: n=10). B: Distribution of Consensus Molecular Subtype (CMS) classifications within each ICR tumor subgroup. C-D: Boxplots detailing comparison of mutation rate (C) and fraction of altered genome (D) among the four ICR subgroups (Mann Whitney U test, p < 0.05, total n=39, Cluster 1: n=27, Cluster 2: n=15, Cluster 3: n=4, Cluster 4: n=3). E: Boxplot comparing PD1 gene expression across the four ICR subgroups (Mann Whitney U test, p < 0.05, n=76, Cluster 1: n=36, Cluster 2: n=25, Cluster 3: n=5, Cluster 4: n=10). F: Comparisons of immune checkpoint genes (PD1, PD-L1, CTLA4, HAVCR2, LAG3) expression in the TCGA READ dataset, with a focus on contrasting Cluster 4-like with other clusters (Mann Whitney U test, *p < 0.05, **p<0.01, ***p<0.001, n=41, Cluster 4-like: n=10, Others: n=31). G: Assessment of Immune cell fractions within the TCGA READ dataset, showcasing differences between Cluster 4-like and other clusters (Mann Whitney U test, *p < 0.05, **p<0.01, ***p<0.001, n=41, Cluster 4-like: n=10, Others: n=31).

