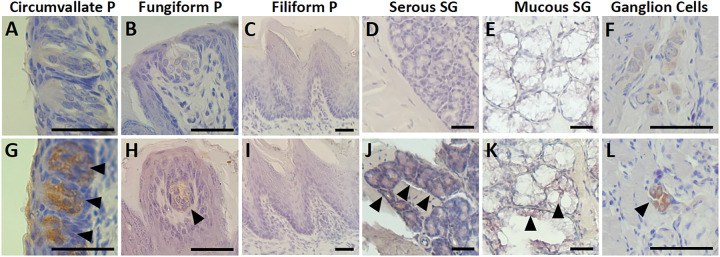
Figure 3. SARS-CoV-2 antigen labeling in the tongue.
Representative images of immunohistochemical labeling (1:200 antibody dilution) of structures of interest with or without infection with SARS-CoV-2. The infected samples at 5 dpi are shown in the lower panels (G, H, I, J, K, L), with arrowheads pointing to positive brown-colored labeling of the SARS-CoV-2 antigen, compared with negative labeling in the mock infected control samples in the upper panels (A, B, C, D, E). The circumvallate papilla taste buds (G) and ganglion cells (L) show positive labeling, while fungiform papilla taste bud (H), serous salivary gland cells (J), mucous salivary gland cells (K) show weakly positive labeling. The filiform papilla cells (I) were negative for labeling.
P, papillae. SG, salivary gland. Scale bars indicate 100 μm.

