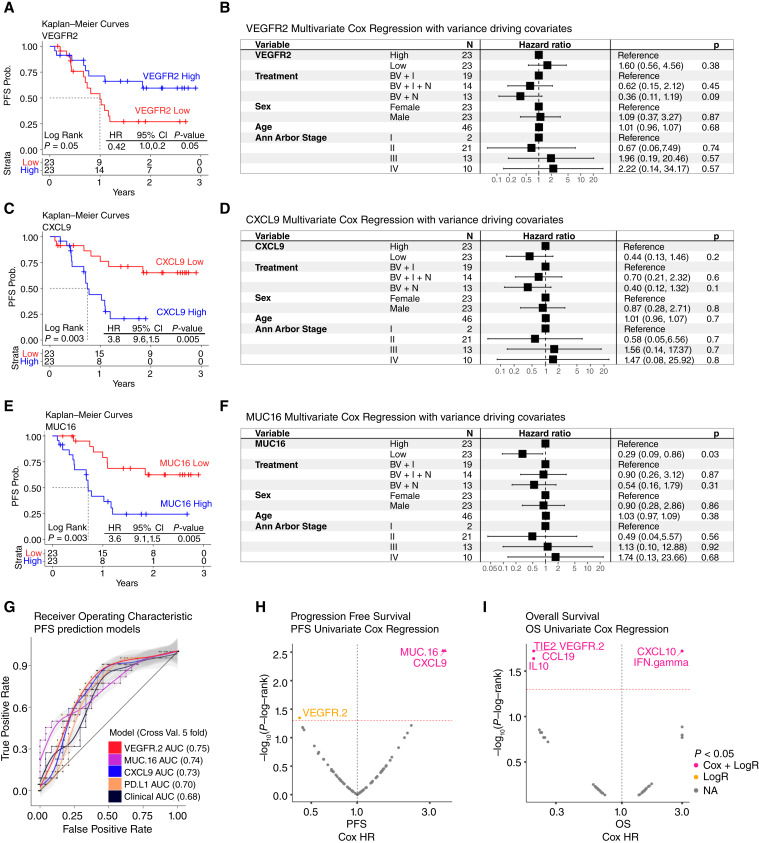
Figure 2.
Association of plasma cytokines with clinical benefit. A, C, and E, PFS survival analysis shows the Kaplan–Meier curves for VEGFR2, CXCL9, and MUC16, respectively. Statistics using log-rank test and Cox proportional hazard models are shown. Higher than median VEGFR2 levels were associated with slower progression whereas higher than median levels of CXCL9 and MUC16 were associated with faster progression. B, D, and F, Forest plots for VEGFR2, CXCL9, and MUC16, respectively. Here, we show the multivariate statistics for each of these proteins including sex, age, treatment type, and cancer stage (Ann Arbor stage). These figures verify the directionality of the KM curves shown and show that these three proteins are independent of these clinically relevant covariates. G, Shows the receiver operating characteristic (ROC) curves for the prediction of PFS using VEGFR2, MUC16, CXCL9, PDL1, and clinical variables. Ordered from most relevant to least relevant model, reflected on the AUC values. H, Univariate PFS Cox modeling of Olink analytes. I, Univariate OS Cox modeling of Olink analytes. Both I and H, show on the x-axis the HR and the y-axis shows the −log10 (P values) based on the log-rank test.

