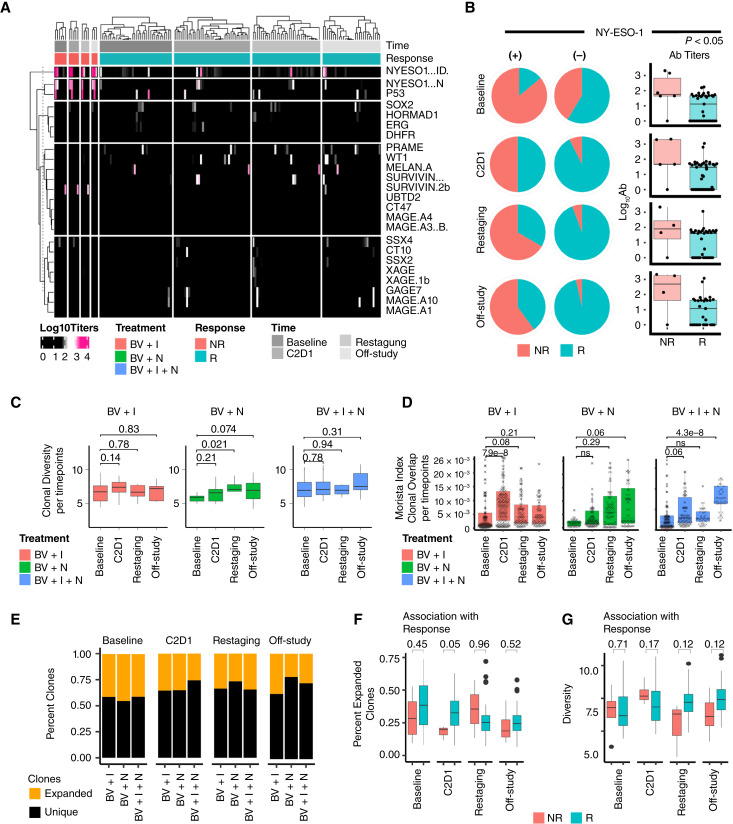
Figure 4.
Cancer antigen detection and T-cell clonal dynamics associated with treatment and response. A, Heatmap showing cancer antigen detection by ELISA for all samples. The color represents the log10 scale antibody titers. Positive detection is considered above levels of 2 (pink), whereas negative detection is represented by the color black. The top rows of the figure show the treatment group, best overall response, and time. The figure is separated into nonresponders (left) and responders (right). Each column box is hierarchically clustered for simplicity. B, Pie charts showing the association of NY-ESO-1 presence (left column) and nondetection (middle column). Boxplots (right column) show all titer levels for nonresponders and responders. C, Boxplots showing the standardized absolute clonal diversity index calculated using Immunarch R package. The clonal diversity changes are shown over four time points (Baseline, C2D1, Restaging, and off-study) per treatment arm. The P value from the Wilcoxon rank test is shown on top of the boxes. The y-axis is identical for all three treatment arms. There was no statistical difference between the treatments due to the observed large variances (patient heterogeneity). D, Boxplots showing an increase in clonal overlap over time for all three treatments. P values were estimated using the Wilcoxon rank test. E, Clonal expansion was stratified into unique and expanded clones (black and orange, respectively). The stacked barplot shows the average percent of each clonal expansion class over time and per treatment arm. There were no statistical differences identified between treatment arms. F, Boxplots showing the percent abundance of only expanded clones shown for responders and nonresponders over time. There were no significant differences between these two groups except for C2D1 using the Wilcoxon rank test. G, Clonal diversity boxplots comparing responders and nonresponders. Overall, responders had a higher diversity, yet it did not reach statistical significance.

