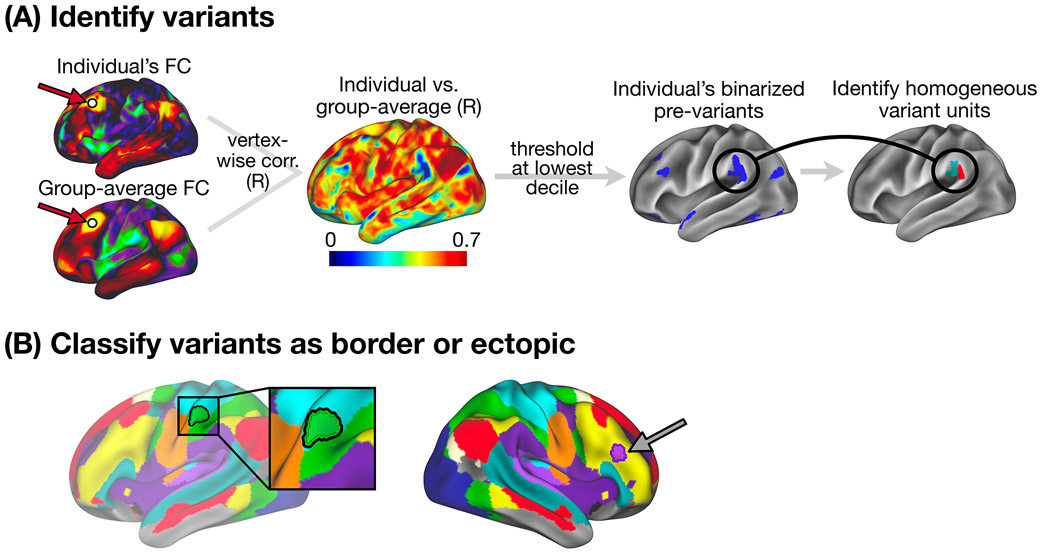
Figure 1: Variant definition, splitting, and classification as border or ectopic.
(A) Following Seitzman et al.15, we used spatial correlation to compare the seedmap at a given location between an individual and an independent group average (left) to generate an individual-to-group “similarity map” (middle). This similarity map was thresholded and binarized to identify locations with low similarity to the group (right) that we call “pre-variants” in this work (Note: these were also thresholded to remove small areas and areas of low signal - see Methods). We then further refined these pre-variants to create homogeneous units for border vs. ectopic variant classification (see Methods and Supp. Fig. 1 for a description of the variant definition process). (B) Each variant was classified as either a border shift or an ectopic intrusion based on its edge-to-edge distance from the nearest same-network boundary in the group-average network map. Here, we display an example of a border shift variant (left, green region with black outline) and an ectopic variant (right, purple region with dark outline), overlayed on the group average network map. Distances > 3.5 mm were classified as ectopic; distances < 3.5 mm were classified as border (see Fig. 2B and Supp. Fig. 8 for exploration of additional distance criteria). We also employed a secondary method for defining border and ectopic variants that did not rely on a group-level network parcellation (see description in Methods and Supp. Fig. 2).

