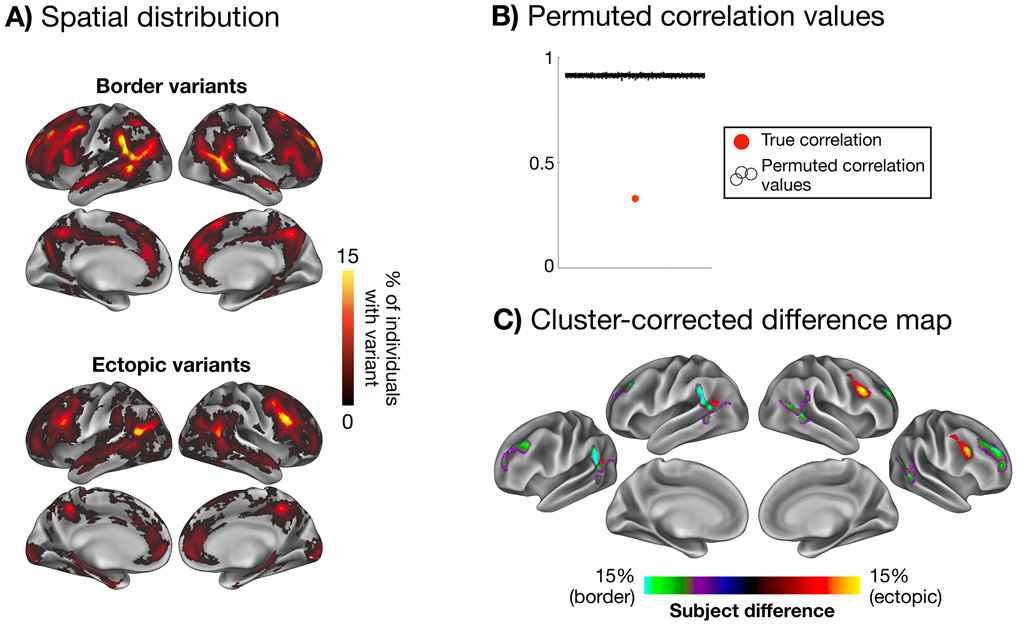
Figure 3: Spatial distributions of ectopic and border variants.
The maps in (A) show the spatial distribution of border variants and ectopic variants, overlapped across participants in the HCP. (B) These two spatial distributions differ significantly more than expected by chance from random permutations. Permuted correlation values are jittered across the x-axis for visualization. (C) A cluster-corrected difference map is shown highlighting regions with a significantly higher occurrence of border variants (green/purple) and ectopic variants (yellow/red; p < 0.05 cluster-corrected for multiple comparisons based on permutation testing). Ectopic variants were more prevalent in the right posterior inferior frontal sulcus and left posterior TPJ regions, while border variants were more prevalent in dorsal and ventral portions of the anterior TPJ and superior rostral frontal regions. See Supp. Fig. 9 for evidence of similar results for ectopic variants at greater distances, Supp. Fig. 10 for similar results using our secondary parcellation-free variant definition method, and Supp. Fig. 11 for border and ectopic overlap maps for each network individually.

