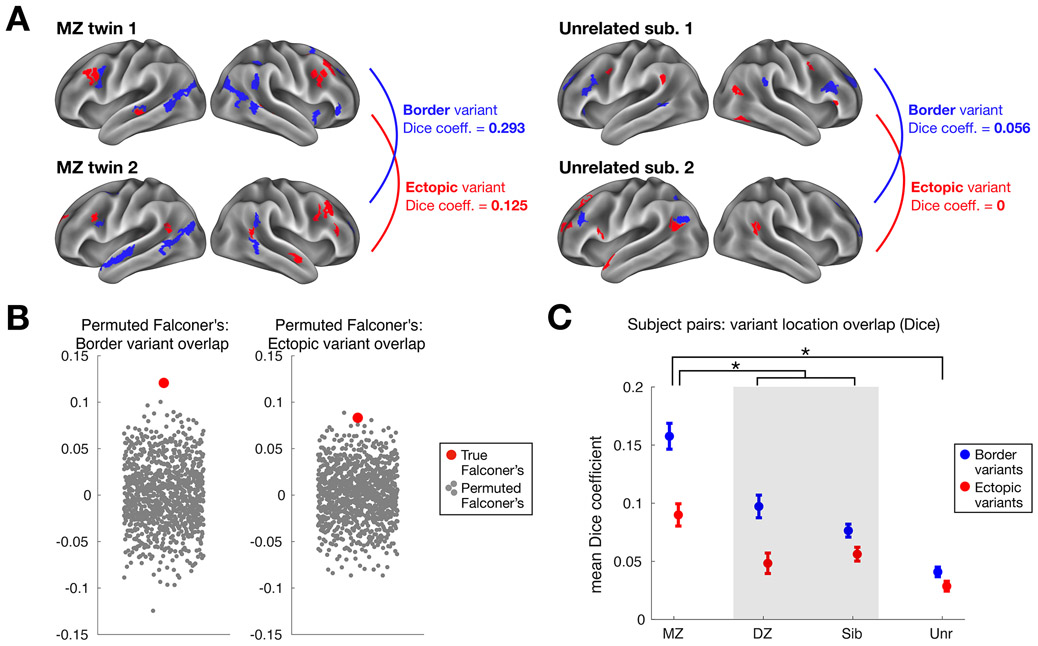
Fig. 6: Estimating the genetic influence of border and ectopic variants across individuals in the HCP dataset.
(A) The similarity of border (blue) and ectopic (red) variant locations was measured for monozygotic (MZ) and dizygotic (DZ) twin pairs, siblings, and unrelated individuals. This schematic shows an example pair of MZ twins (left) and unrelated individuals (right). The MZ twins exhibit a greater Dice coefficient of overlap between their border variants (in blue) and ectopic variants (in red) than a pair of unrelated subjects. (B) This observation was confirmed by estimating genetic influence with Falconer’s formula, which compares similarity in MZ and DZ twins. Both border and ectopic variants (red dots) exhibited significant similarity (p<0.001 and p<0.002 respectively) relative to a permuted null (gray dots) where MZ and DZ labels were randomly shuffled (*note, our use of Dice instead of R-values in Falconer’s formula does not produce heritability estimates, but does provide a valid way to assess non-zero genetic influence via permutation testing, randomly shuffling MZ and DZ labels). (C) Average similarity among border and ectopic variants is shown for pairs of HCP participants. For both forms of variants, MZ twins (N= 88 pairs) showed the highest similarity, DZ twins (N=45 pairs) and siblings (N=137 pairs) showed intermediate similarity, and unrelated individuals (N=122 pairs) showed the lowest similarity, a pattern consistent with an influence on genetics on variant locations. A two-way mixed-effects ANOVA revealed a significant interaction between variant group and form (p<0.001), with unpaired t-tests (assuming unequal variance) revealing a larger difference between variant forms in MZ pairs compared to DZ/non-twin sibling pairs (p=0.015) and to unrelated individuals (p<0.001). Bars represent standard error across subject pairs, with mean Dice coefficient across pairs at the center.

