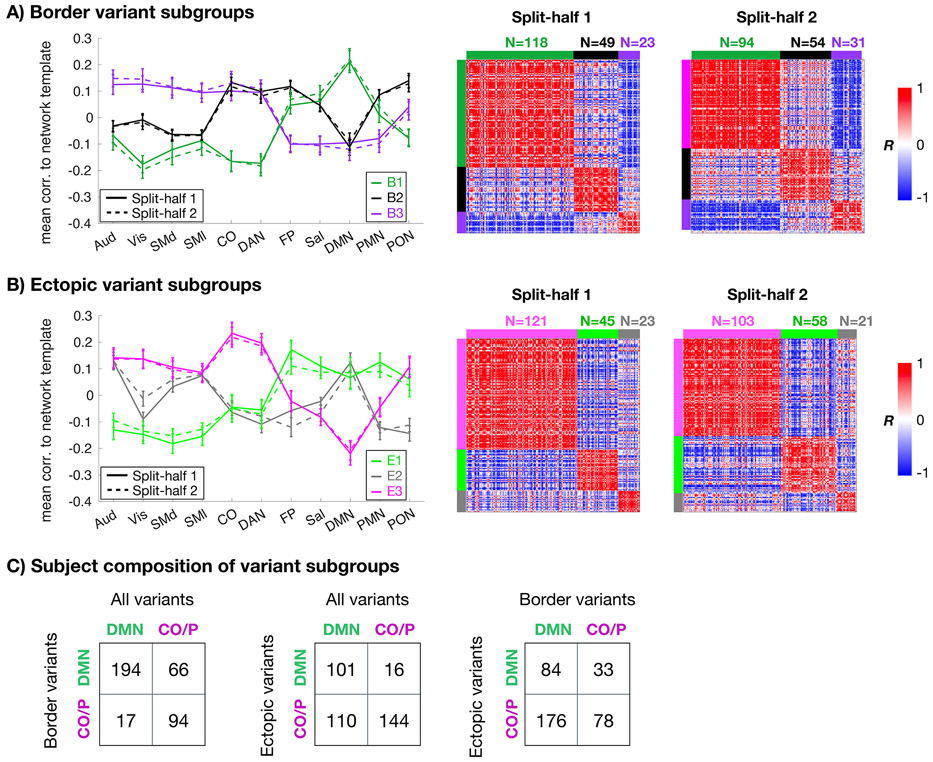
Fig. 7: Similarity of border and ectopic variants across subgroups of individuals.
For border variants (A) and ectopic variants (B), we separated individuals into subgroups based on the average network similarity vector of their variants (left). Matrices on the right show across-subject similarity (correlation) of variant profiles for each split-half in the HCP. Color blocks at the edges of the matrices denote the subgroup identities. The two variant forms produced three subgroups each with high similarity across matched split-halves of the HCP data. However, the subgroups differed between the two forms. Error bars in (A) and (B) represent standard error of correlation values across subjects within a given subgroup/split-half. (C) Contingency tables show the composition of subgroups in which each individual’s variant profile (all variants, border variants only, and ectopic variants only) was forced to sort into either a DMN-like subgroup or a control/processing subgroup. Note that ectopic and border variant subgroup labels had poor association with one another.

