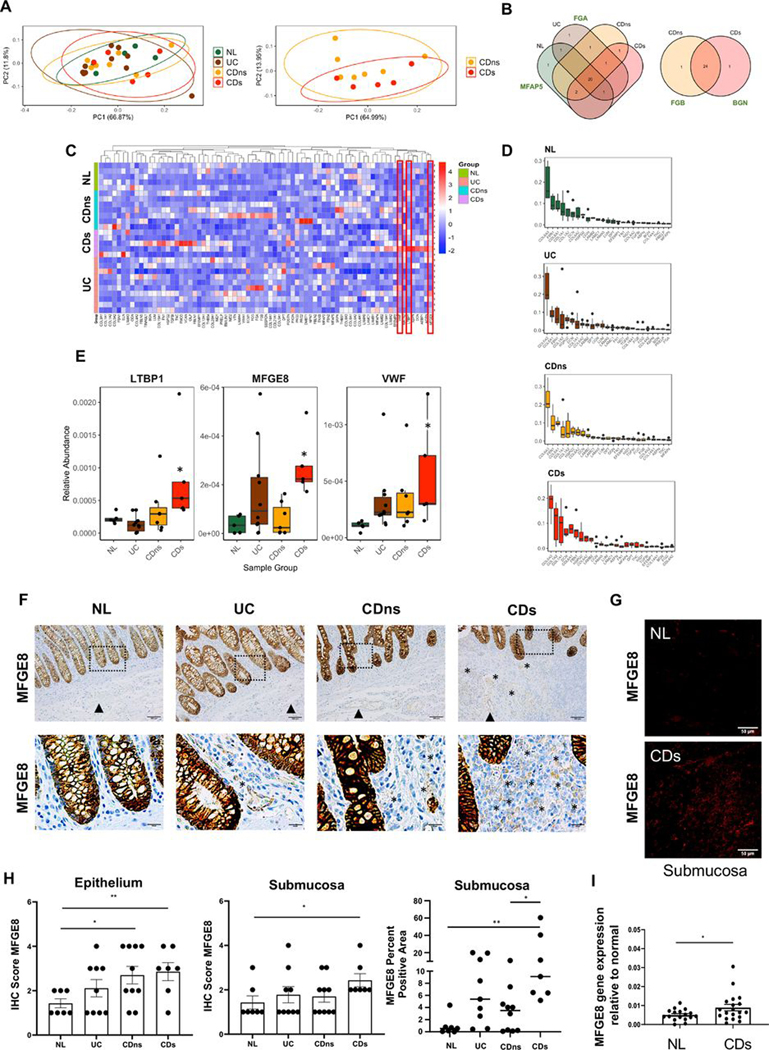
Figure 1.
Matrisome analysis of decellularised intestinal resection tissues from patients with IBD and controls. Mass spectrometry analysis of extracellular matrix (ECM) proteins of different tissue phenotypes was performed, and results were calculated relative to the total amount of ECM. (A) Principal component analysis of the relative abundance of matrisome proteins produced by normal (NL), UC, non-strictured Crohn’s disease (CDns) and strictured Crohn’s disease (CDs). Ellipses indicate 95% CIs. No separation of the matrisome components was noted between NL, UC, CDns and CDs (left graph) as well as between CDns and CDs (right graph; n=27). (B) Proteins detected in each tissue phenotype. Venn diagrams were created using present matrisome components among the four phenotypes. Most matrisome components were expressed by all phenotypes with the only uniquely expressed proteins being delineated next to the Venn diagram (n=27). (C) Unsupervised hierarchical clustering of matrisome proteins (normalised relative abundance) for each phenotype indicating a large qualitative and quantitative overlap of matrisome expression across all phenotypes. The three molecules with differential expression between the phenotypes are marked with red boxes (n=27). (D) Top 25 ECM proteins for each phenotype ranked by level of abundance. The top 5 matrisome proteins across the tissue phenotypes NL, UC, CDns and CDs were collagen VI, fibrillin 1, collagen 1, decorin and perlecan (n=27). (E) Relative abundance of matrisome molecules with significant difference between the phenotypes. The three molecules identified were latent latent transforming growth factor-β binding protein 1, milk fat globule-epidermal growth factor 8 (MFGE8) and von Willebrand Factor (n=27). * indicates a significant difference compared with NL. (F) Immunohistochemistry (IHC) staining for MFGE8 expression in colon tissues identified intestinal epithelial cells as the major source of MFGE8. Slides are representative of n=33. Dotted box inserts represent the magnified areas in the lower row. (G) Immunofluorescence for MFGE8 focusing on the submucosa as the area with the highest ECM expression reveals increased MFGE8 in CDs compared with NL. Slides are representative of n=12. (H) Quantification for MFGE8 expression using a blinded IHC score indicated upregulation of MFGE8 in the epithelium of CDns and CDs compared with NL and in the submucosa of CDs compared with NL (n=33). Right panel depicts automatic quantification of the MFGE8 surface area in the submucosa. (I) Real-time PCR analysis revealed that MFGE8 gene expression was elevated in CDs resection tissues compared with NL (n=36). Data are presented as mean±SEM. *, p<0.05; **, p<0.01. NL, normal; CDs, strictured Crohn’s disease; CDns, non-strictured Crohn’s disease; FGA, fibrinogen-α; FGB, fibrinogen-ß; MFAP5, microfibrillar-associated protein antigen 5; BGN, biglycan; LTBP1, latent transforming growth factor-β binding protein 1; MFGE8, milk fat globule-epidermal growth factor; VWF, von Willebrand Factor; IHC, immunohistochemistry.

