. 2024 Jul 15;14(31):22393–22402. doi: 10.1039/d4ra02830a

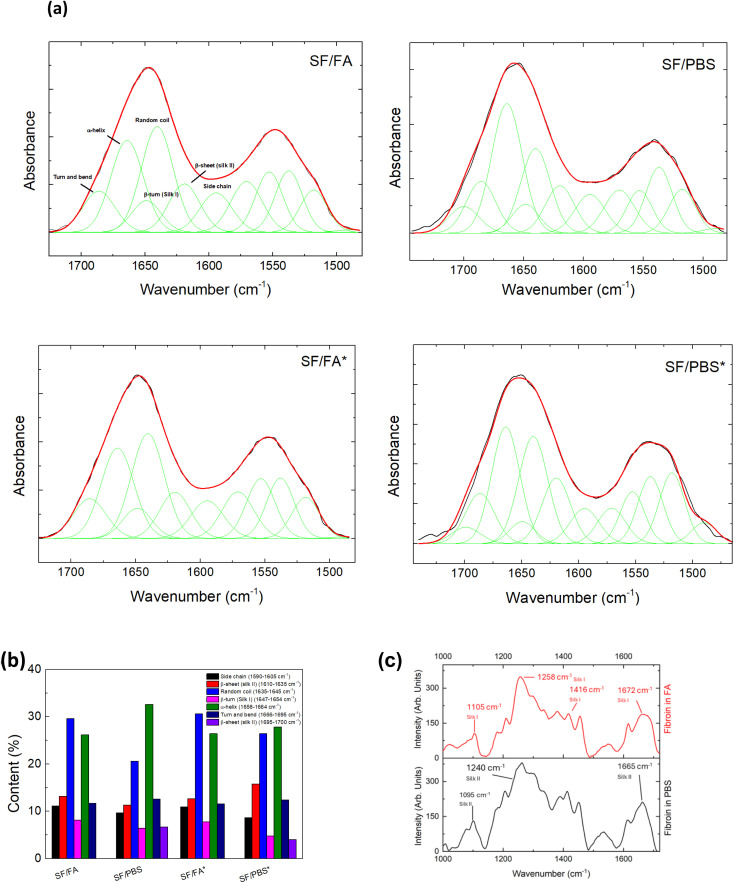
Fig. 1. (a) ATR-FTIR spectra (black line) and results of curve-fitting procedure (red and green lines) of SF films prepared by different processes and ultrasound treatment (the asterisks indicate the ultrasound treatment). (b) Relative weight of components obtained by curve-fitting procedure of ATR-FTIR spectra of SF films prepared by different processes and ultrasound treatment (the asterisks indicate the ultrasound treatment). The peak assignment of the amide I region in the 1610–1700 cm−1 range was done according to that reported by Lu et al.23 Feature centered at frequencies out of this range were included to reproduce the amide I and II profile but were not considered to estimate the weight of the different protein conformations. (c) Raman spectra of SF films prepared from FA (red – upper panel) and PBS regenerated fibroin solutions (black – lower panel).

Fig. 1