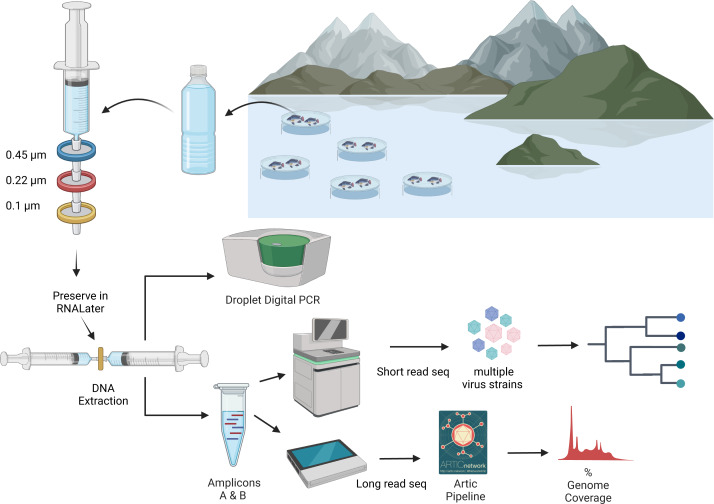
Figure 2. An overview of processing of water samples from around the tilapia cages on Lake Volta.
The figure illustrates the concentrating of ISKNV onto filters, through to DNA extraction, quantification, and sequencing for variant detection. Figure was generated with BioRender (https://biorender.com/). Artic pipeline logo taken from https://artic.network/ncov-2019/ncov2019-bioinformatics-sop.html.

