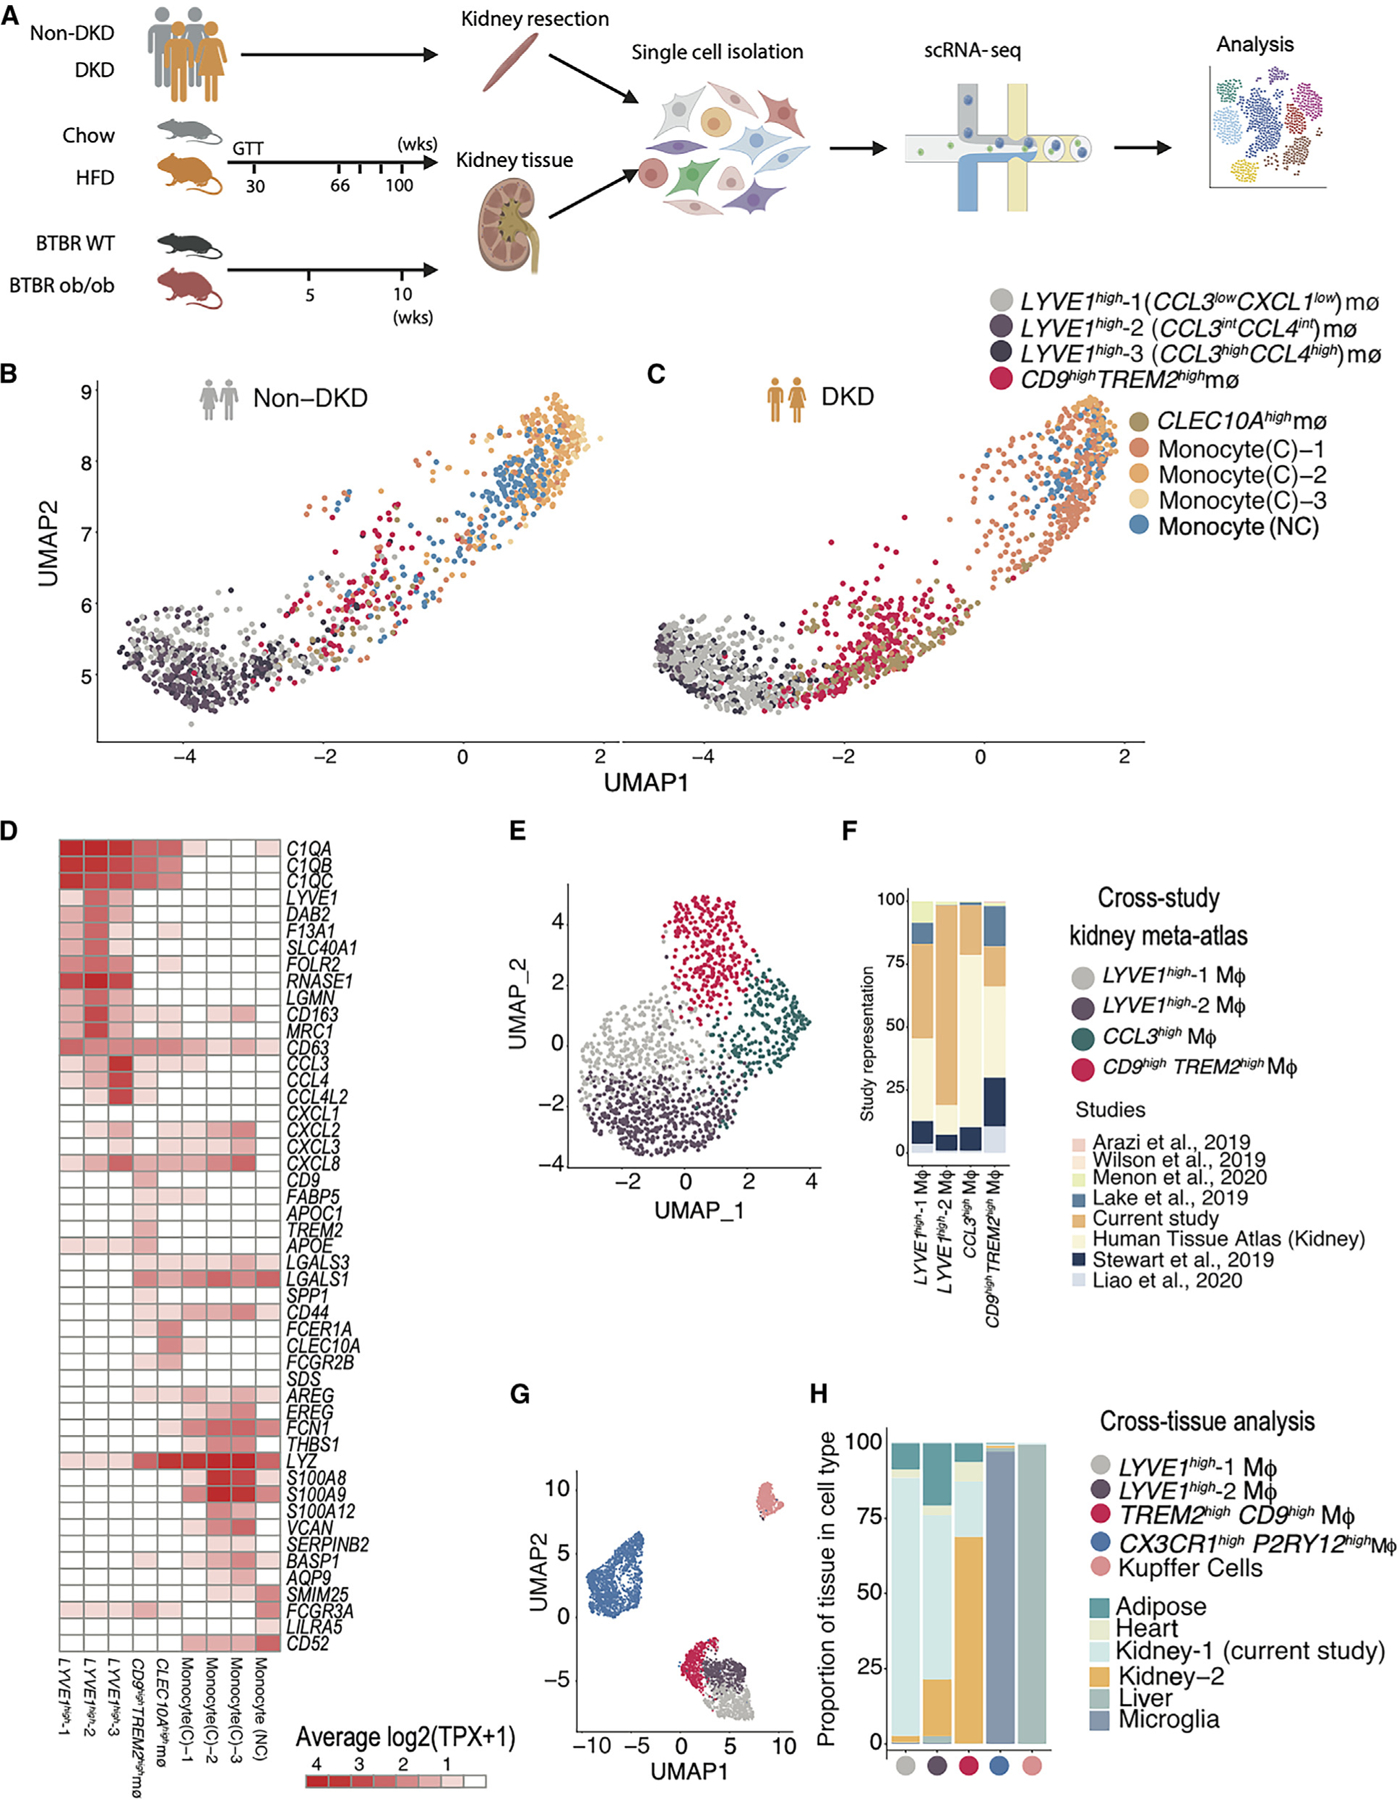
Figure 1. Heterogeneous macrophage subsets in human diabetic kidney at single-cell resolution.

(A) Experimental timeline and sampling outline for kidney tissue from two mouse models and nephrectomy specimens from patients with and without DKD. Kidney cortex obtained at equivalent time points from HFD- and chow-fed mice (aged 66–100 weeks, n = 4 biological replicates in each condition), BTBR ob/ob and BTBR wt/wt mice (aged 5–10 weeks, n = 5 for 5 weeks and N = 3 for 10 weeks), and non-tumor tissue margins of patients undergoing tumor nephrectomy (n = 3 [DKD] and 9 [non-DKD]) was dissociated using the same enzymatic protocol.
(B and C) UMAP visualization of macrophages (MΦ) in the human non-diabetic and diabetic kidney, highlighting macrophage and monocyte populations. Each point represents a cell. Individual populations are represented by distinct colors.
(D) Heatmap visualization of expression programs distinguishing the human macrophage and monocyte populations (columns). Rows are genes that are differentially expressed in each MΦ population. Values (color) represent row-normalized average gene expression in units of log-transformed transcripts per X (log(TPX+1)) (scaling factor, 10,000).
(E) UMAP visualization of MΦs from a human kidney meta-atlas derived from 8 different human kidney scRNA-seq studies (N = 49). Each point represents a cell. Individual populations are represented by distinct colors.
(F) Bar plot of study representation (fraction, y axis) among the human kidney scRNA-seq meta-atlas macrophage subsets (x axis).
(G) UMAP visualization of co-embedding of MΦs from human adipose, heart, liver, microglia, and kidney revealed 5 populations: LYVE1high, CCL3highLYVE1high, CX3CR1highPY2R1high, CD9highTREM2high, and Kupffer cells. Each point represents a cell. Individual populations are represented by distinct colors.
(H) Bar plot of tissue composition (fraction, y axis) among the human cross-tissue macrophage subsets (x axis).
