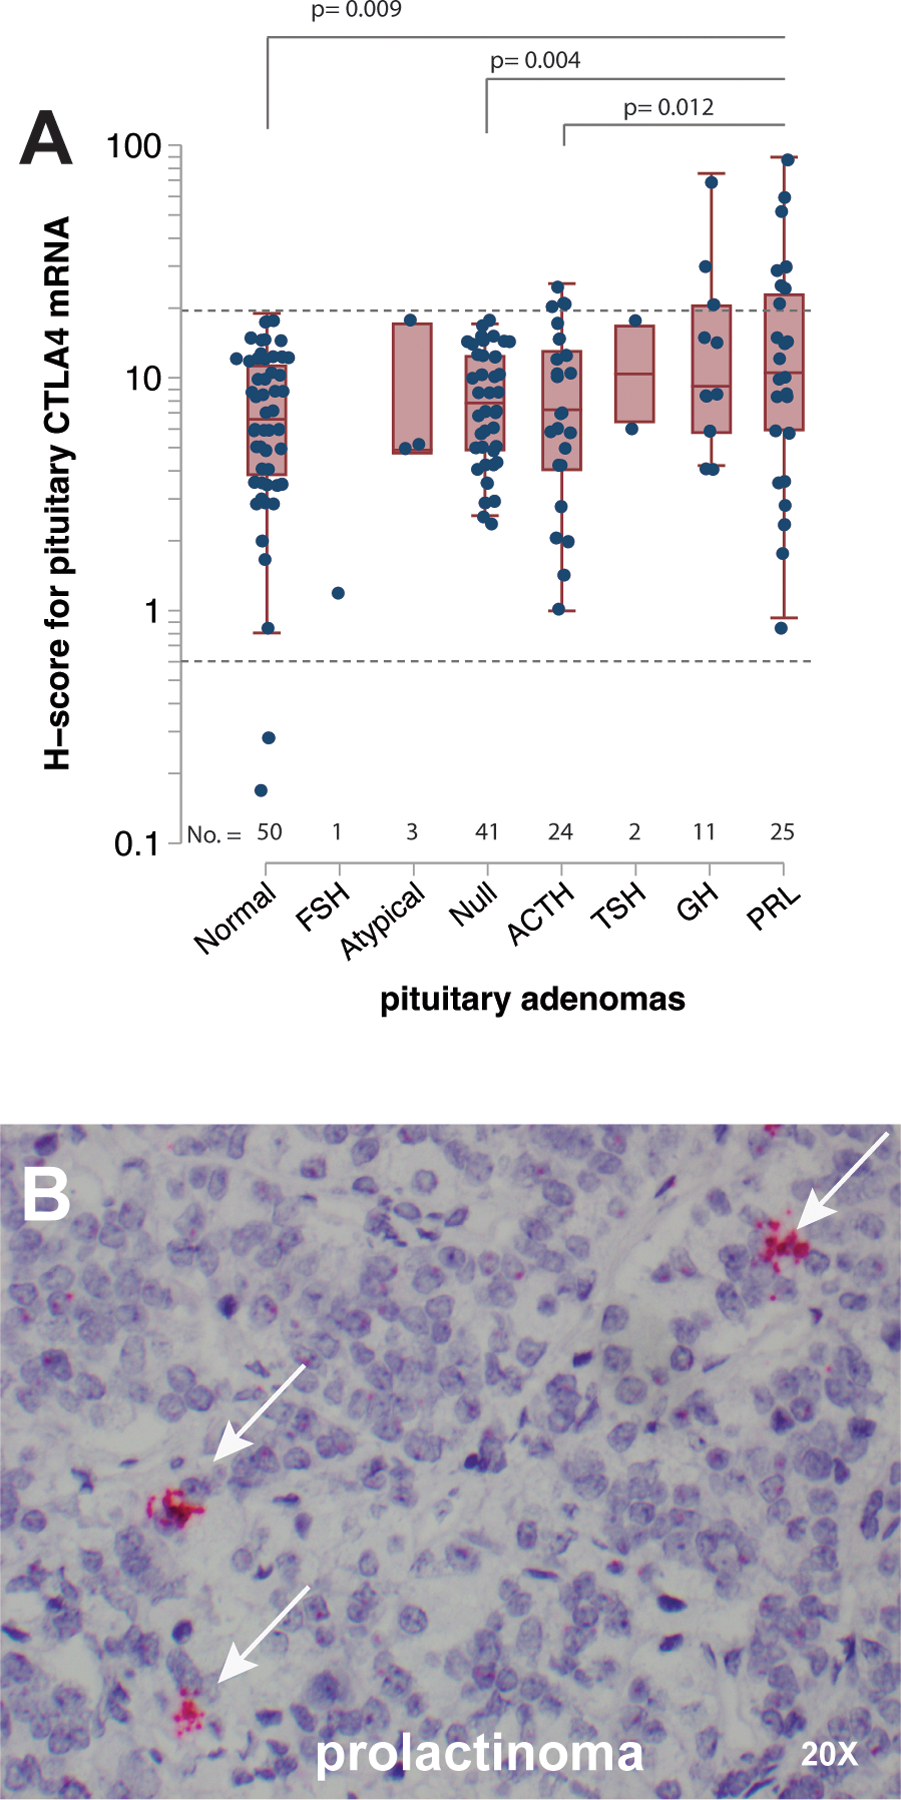
Figure 3. CTLA4 expression in a large panel of pituitary adenomas.

(A) Quantification of CTLA4 mRNA expression by RNAscope in 107 pituitary adenomas, consisting of 25 PRL-, 11 GH-, 2 TSH-, 24 ACTH-, and 1 FSH-secreting, as well as 41 non-secreting and 3 atypical specimens. The expression of CTLA4 in 50 normal pituitary samples (5 from surgical pathology and 45 from rapid autopsy) is also shown for comparison. The dotted horizontal line indicates a H-score value of 25. (B) Representative image of a PRL-secreting adenoma expresses high levels of CTLA4 mRNA. The white arrows indicate clusters of CTLA-mRNA transcripts. Each red dot represents a single copy of CTLA4 transcript. Original magnification times 20.
