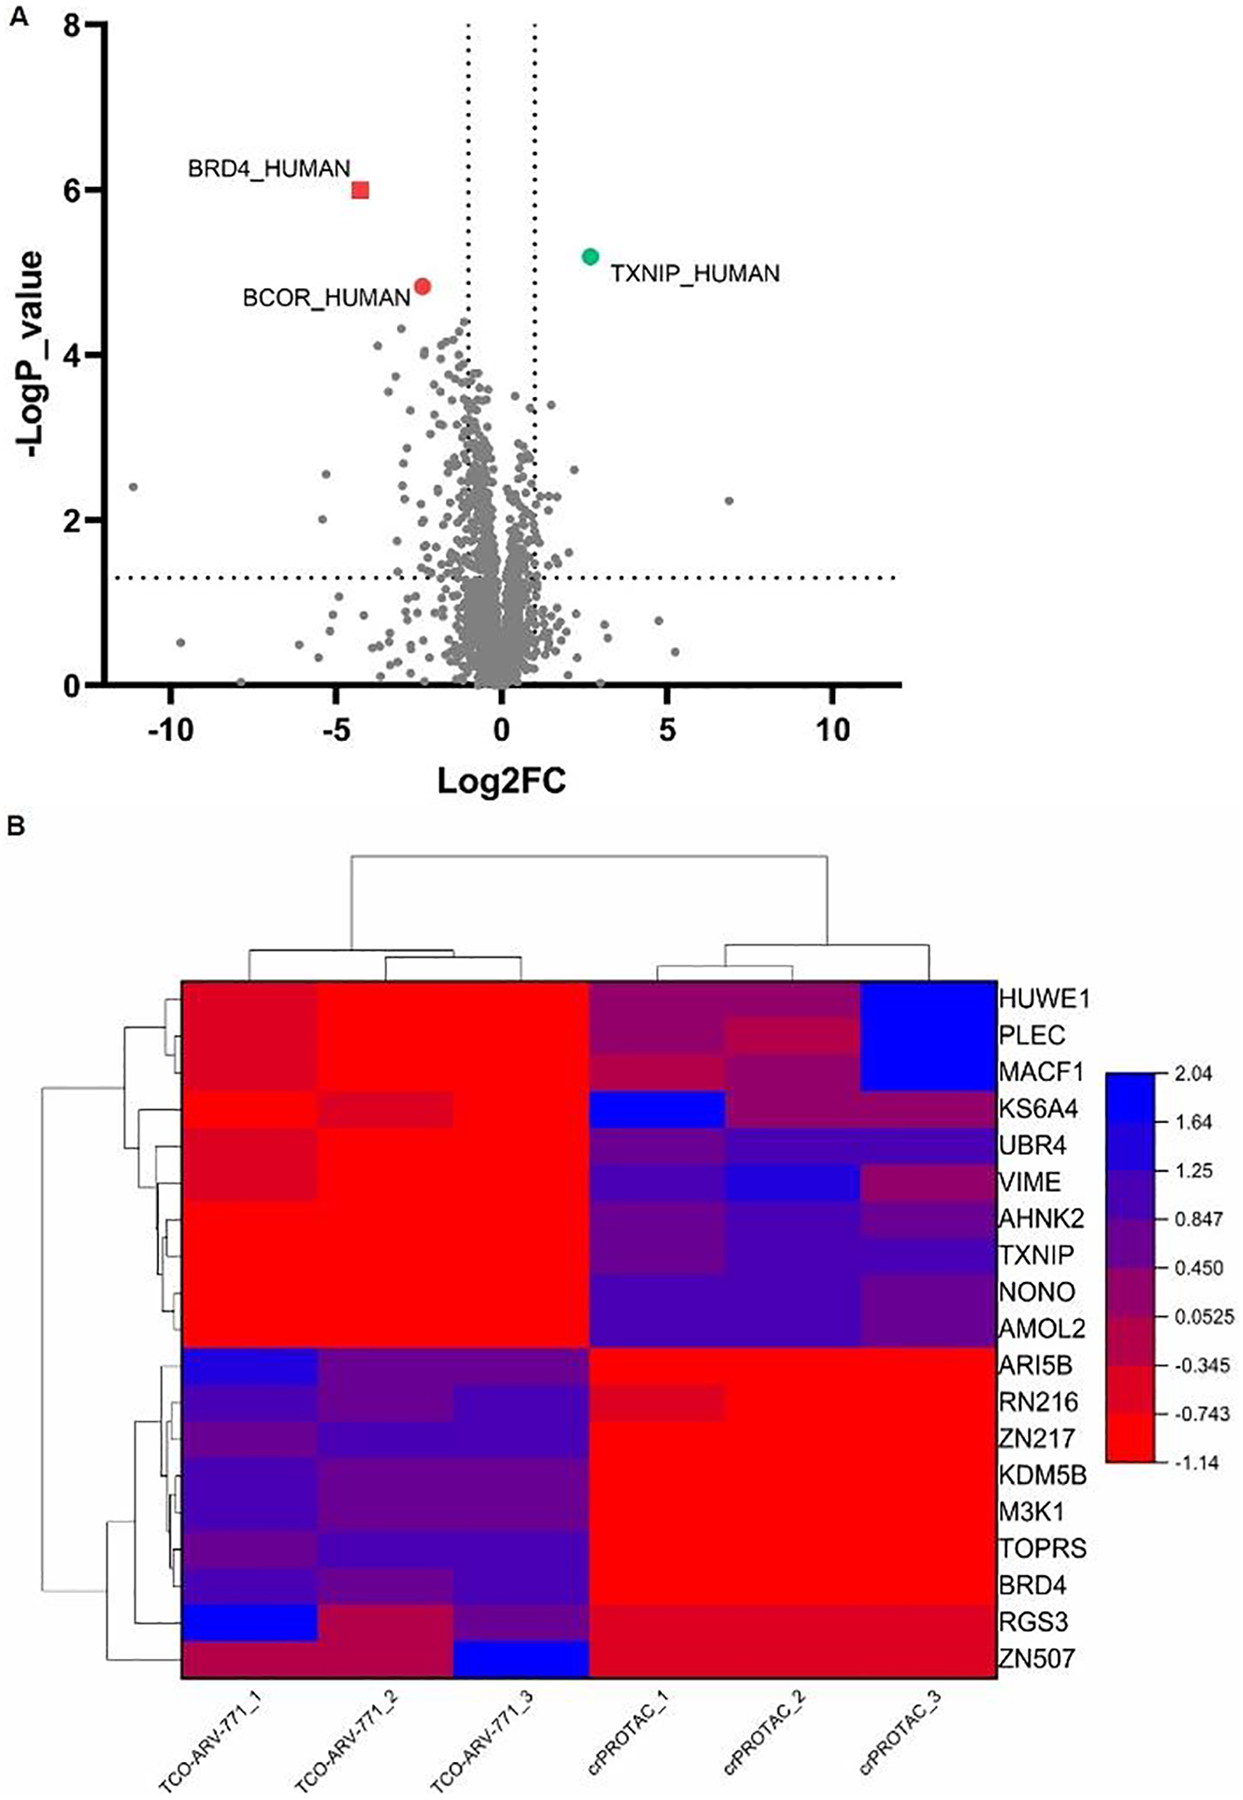
Figure 6: The proteomic analysis of TCO-ARV-771 and crPROTAC.

HeLa cells were treated with either compound 0.4 μM TCO-ARV-771, or 1 μM c(RGDyK)-Tz (3 h, pretreatment) + 0.4 μM TCO-ARV-771 for 16 h. Lysates were subjected to mass spec-based proteomics analysis. A) Volcano plot shows protein abundance (log2) as a function of significance level (-log10). B) Heat map analysis to screen between TCO-ARV-771 and crPROTAC groups (TCO-ARV-771 + c(RGDyK)-Tz, 3 h).
