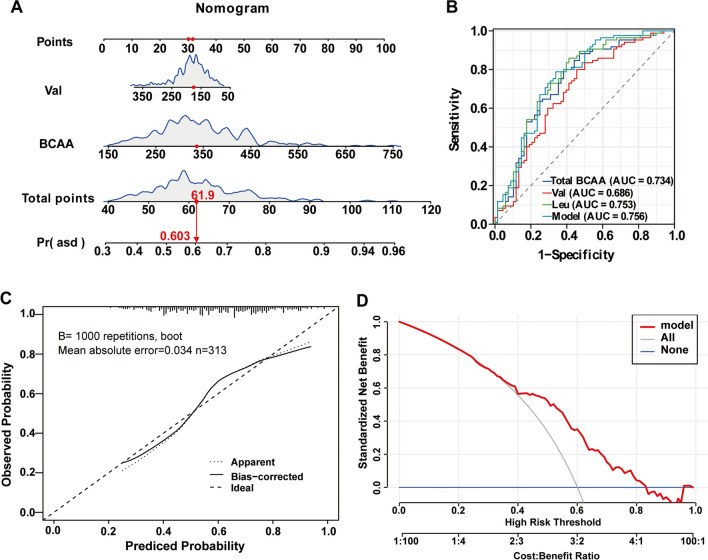
Fig. 3.
Nomogram for predicting the risk of ASD and model evaluation. A A nomogram was constructed based on two independent predictors, and the values of the included factors are marked on the corresponding axis. A vertical line was drawn from the value to the top lines to get the corresponding points. The points identified on the points scale for each variable were summed to obtain the probability of ASD. B ROC curves for evaluating the model’s discriminatory ability. C Calibration plot of the risk nomogram. The ideal outcome (dashed line), the observed outcome (fine dashed line), and the bias-corrected outcome (solid line) are depicted. D DCA for the risk nomogram. The y-axis shows the net benefit. The grey solid line represents the assumption that all patients had ASD. The blue solid line represents the assumption that none of the patients had ASD. The red solid line represents the risk nomogram

