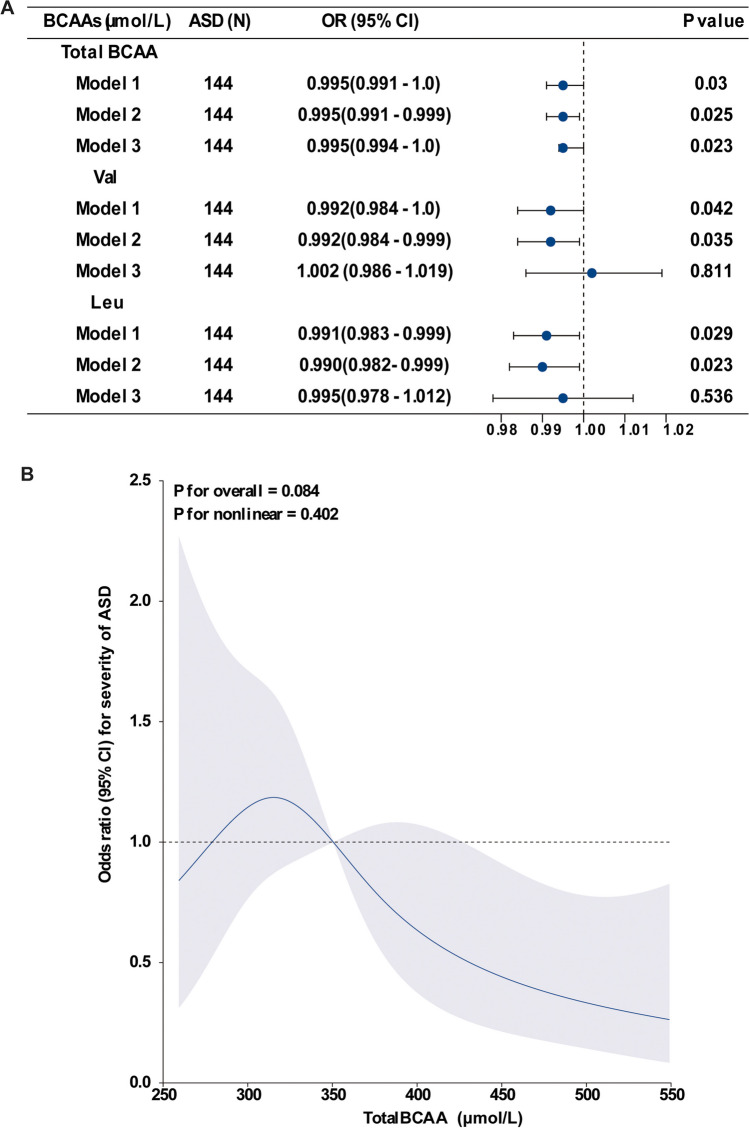
Fig. 5.
Association of concentrations of BCAAs in DBSs with severity of ASD. A Multiple logistic regression analysis of the associations between concentrations of BCAAs and severity of ASD. Model 1, not adjusted. Model 2, adjusted for age, gender, and BMI. Model 3, adjusted for age, gender, BMI, and levels of total BCAAs, Val, and Leu. The blue dots represent the adjusted OR, and the horizontal lines represent the 95% CI. B Restricted cubic spline model of the odds ratios of severity of ASD with total BCAA levels in DBSs. The blue line and blue shadow represent adjusted odds ratios and 95% confidence intervals, respectively. The black dotted line represents odds ratios = 1.00

