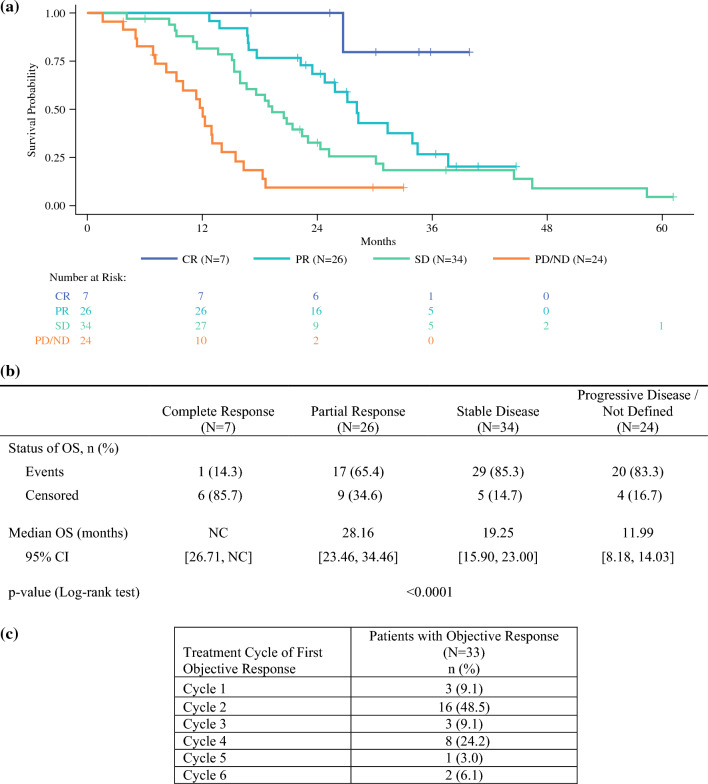
Fig. 2.
Post hoc analysis. a Kaplan-Meier plot of overall survival by best overall response. b Overall survival by best overall response and c first occurrence of objective response by treatment cycle in patients treated with the melphalan/Hepatic Delivery System (treated population, assessed by Independent Review Committee). CI, confidence interval; CR, complete response; NC, not calculable; ND, not defined; OS, overall survival; PD, progressive disease; PR, partial response; SD, stable disease

