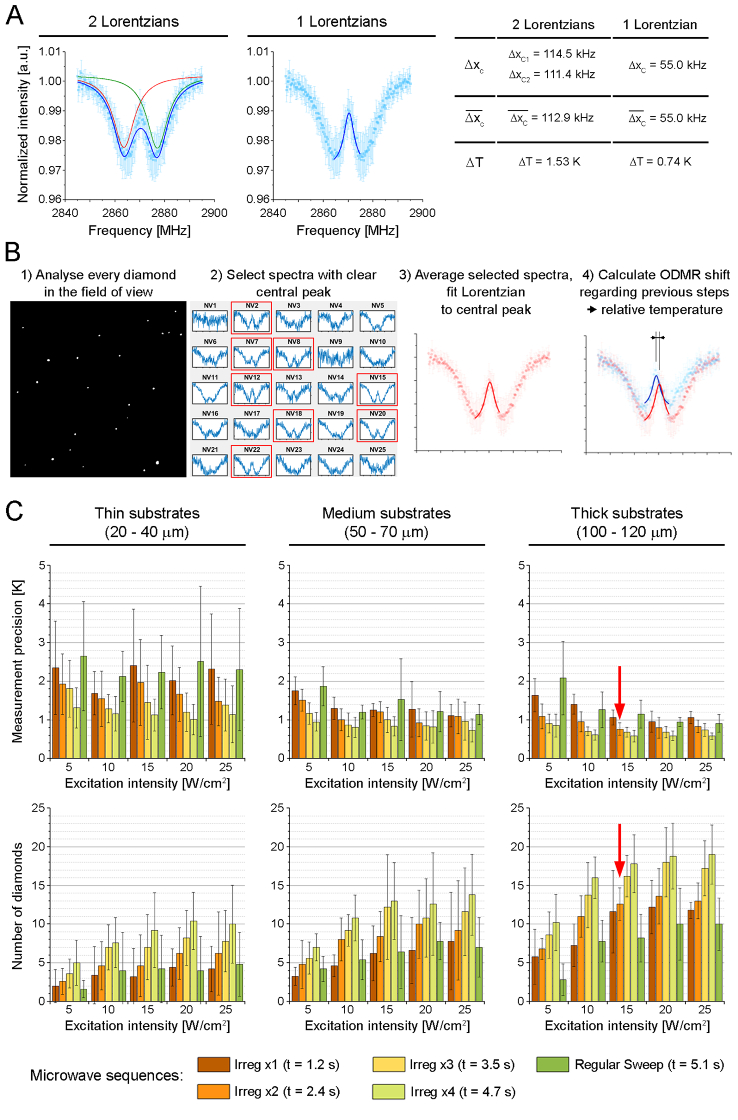
Fig. 3.
A: Precision of the determination of the center of the ODMR spectrum fitted by two Lorentzian functions compared to one Lorentzian function. denotes the uncertainty of the position of the fitted Lorentzian peak (least square method), denotes the mean value of the measured , the temperature uncertainty was calculated assuming a slope of -74.2 kHz/K, according to Acosta et al. [41]. B: Sketch of the estimation of the relative temperature averaged in a field of view. C: Optimization of the ODMR experiment, effect of the excitation intensity and microwave sequences on the precision of the temperature measurement (top row) and the number of diamonds included in the analysis (bottom row). Optimized experimental conditions are marked in both rows by red arrows.

