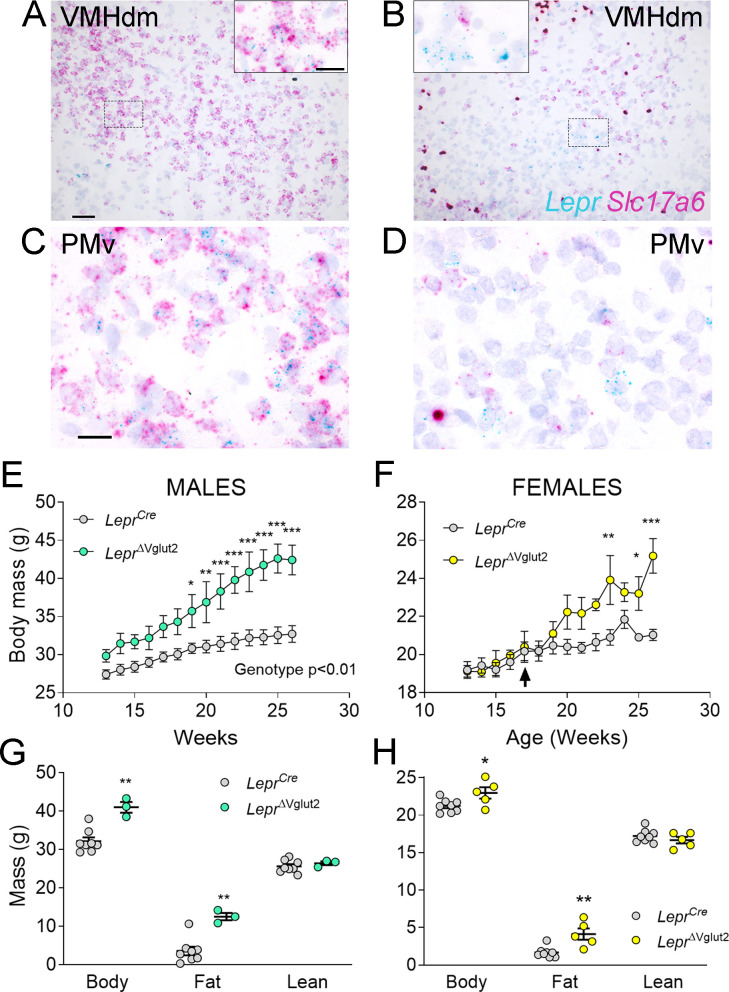
Figure 4. Adult LeprΔVglut2 animals show an obese phenotype.
(A–D) Micrographs of in situ hybridization showing colocalization between Lepr (cyan) and Slc17a6 (magenta) gene expression. Dorsomedial region of the ventromedial hypothalamic nucleus (VMHdm) in control LeprCre (A), but no colocalization in experimental LeprΔVglut2 (B) females. Insets show high magnification images for the area in the dashed rectangles (C, D). Ventral premammillary nucleus (PMv) at large magnification in control LeprCre (C), and experimental LeprΔVglut2 (D). Scale bars: 50 µm for A, B and 20 µm for insets and C, D. (E) Body mass in adult LeprCre and LeprΔVglut2 males (genotype main effect; F1,10 = 13.1; p = 0.0047, post hoc comparison: week 20: t140 = 3.27; p = 0.019; week 26: t140 = 5.47; p < 0.0001). (F) Body mass in adult LeprCre and LeprΔVglut2 females (genotype main effect; F1,11 = 4.34; p = 0.06; post hoc comparisons: week 23: t154 = 4.05; p = 0.0011; week 25: t154 = 3.1; p = 0.03; week 26: t154 = 5.59; p < 0.0001). The arrow indicates the age at which estrus cycling follow-up finished in this cohort. (G) Body composition in males (fat mass: t9 = 3.77; p = 0.004) and (H) in females (fat mass: t11 = 3.7; p = 0.0035). *p < 0.05, **p < 0.01, ***p < 0.001.

