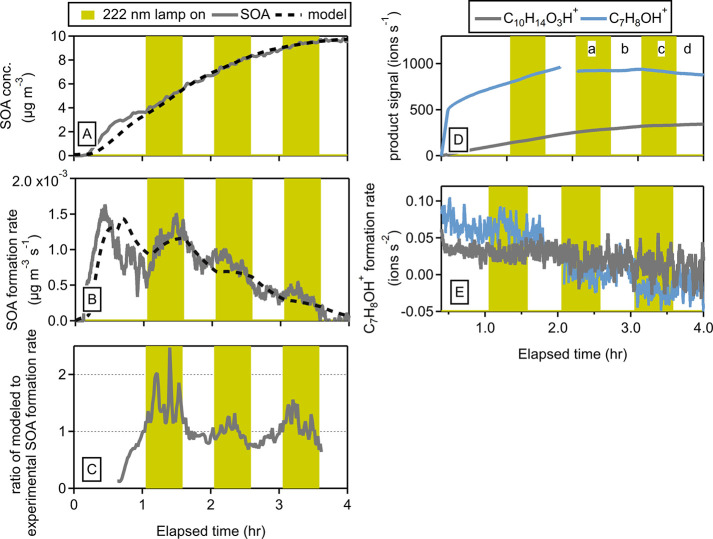
Figure 3.
Experimental and modeled SOA produced from the oxidation of limonene (A), the experimental and modeled SOA formation rate (B), and the ratio of the modeled SOA to the experimental SOA formation rates (C) under dry conditions; gas-phase products produced from the oxidation of limonene (D), and the gas-phase products formation rates (E) under dry conditions.

