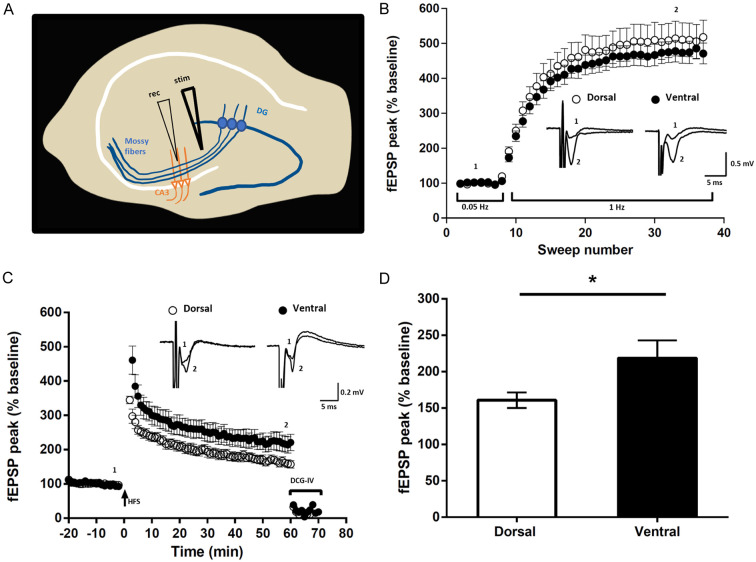
Figure 12.
Properties of mossy fiber field EPSPs examined in transverse slices of rat dorsal vs. ventral hippocampus. A. Schematic of a hippocampal slice showing the positioning of stimulating (stim) and recording (rec) electrodes. B. Plot showing FF at mossy fiber synapses, where increased stimulation frequency from low (0.05 Hz) to moderate (1 Hz) stimulation produced a pronounced increase in fEPSP amplitude. Inset traces represent averaged response when stimulated at 0.05 Hz (1) and at 1 Hz (2) as indicated. C. Induction of LTP at mossy fiber synapses is independent of NMDAR activation, as shown by the persistence of mossy fiber LTP recorded in the presence of the NMDAR antagonist APV. Inset traces represent averaged response recorded before (1) and 60 min after high-frequency stimulation (HFS) (2) as indicated. At the end of the LTP induction protocol, the large degree of inhibition (75-80%) of fEPSPs by the mGluR2 agonist DCG-IV verified that stimulation evoked responses originated from activation of mossy fiber synapses. D. Averaged fEPSP amplitude measured from the last 5 min of LTP in dorsal and ventral hippocampal slices, showing significantly greater potentiation in the ventral slices. *P < 0.05, unpaired Student’s t test with Welch’s correction and error bars representing s.e.m.

