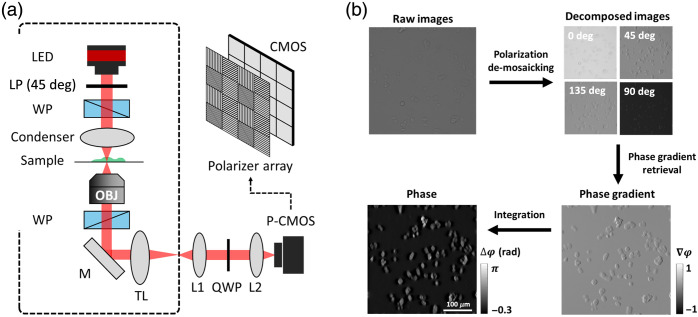
Fig. 1.
Schematic of ss-QPGM instrumentation and data processing workflow. (a) The instrument consists of a typical DIC microscope, as shown by the dashed black line, with a ss-QPI module added. The most critical addition is the use of a polarization filter array positioned in front of the CMOS sensor array. P-CMOS, polarization-sensitive CMOS camera; LP, linear polarizer; WP, Wollaston prism; TL, tube lens; M, mirror; L, lens; QWP, quarter-wave plate. (b) The workflow to obtain quantitative phase data consists of four major steps. First, the acquired data are de-mosaicked into four individual images. Second, spatial frequency-preserving interpolation is used to obtain full field-of-view images for each polarization. Third, a phase gradient image is computed from the four images; fourth, the phase image is estimated through integration.

