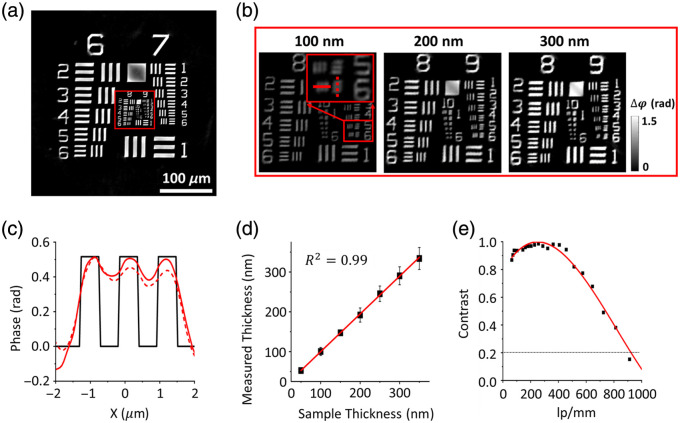
Fig. 2.
Quantitative measures of performance for ss-QPGM. (a) Reconstructed quantitative phase image of the calibration phase target. (b) Magnified images of the location marked with the red solid rectangles in panel (a). (c) Line profiles of the phase along the red solid and dashed lines in magnified boxes in panel (b). The red solid line and dashed line are profiles along the -axis and -axis, respectively. (d) The calculated thickness of the phase targets with seven different thicknesses by ss-QPGM. (e) MTF curves of ss-QPGM.

