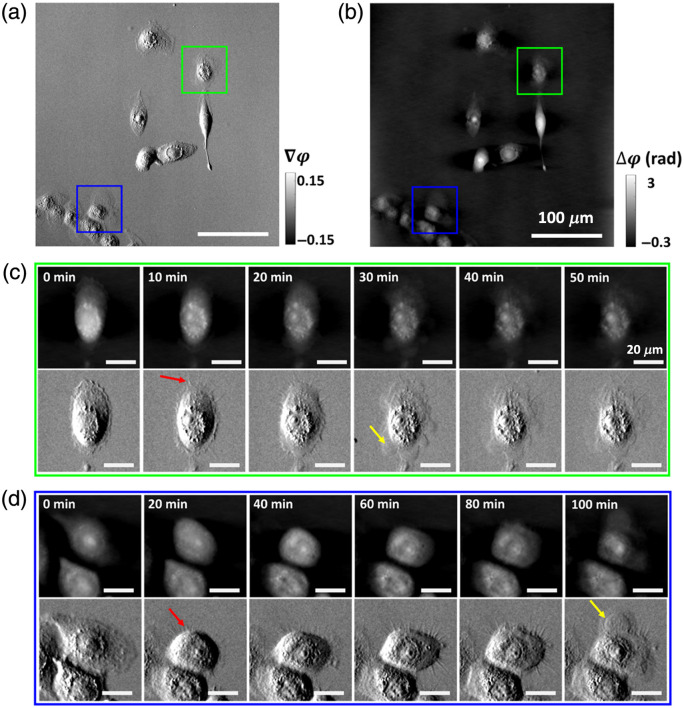
Fig. 3.
Representative ss-QPGM image frames from the time-lapse live-cell imaging data obtained for the M2 cells. (a) The gradient phase and (b) the reconstructed phase image. (c), (d) Multiple image frames [from cells indicated by green and blue boxes in panels (a) and (b)] captured at different time points during nutrient deprivation-induced cell death. Several morphological changes can be seen in different frames (see Sec. 3). Spine-like features and membrane rupture are indicated by red and yellow arrows, respectively.

