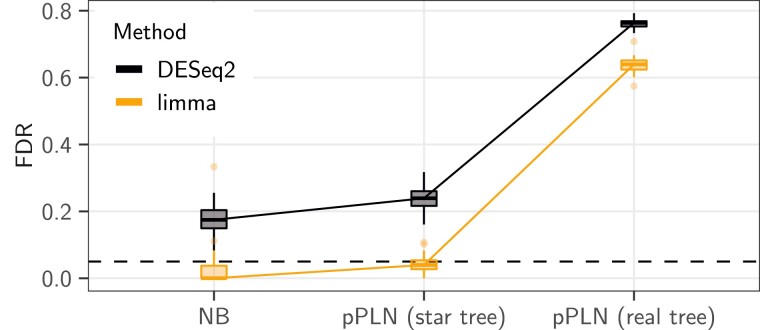
Fig. 2.
The base scenario [pPLN (real tree), right] had empirical moments drawn from (Stern and Crandall 2018a), with an effect size of , a BM model of evolution with added intraspecies variation accounting for of the total variance, on the maximum likelihood tree, with the observed “sight” groups (see fig. 1). It is compared with a pPLN model with the same parameters, but in a case where all samples were independent [pPLN (star tree), middle], and to a NB model with the same moments and effect size (NB, left). The DESeq2 (black) and limma (light orange) inference methods were applied to each scenario. The black dashed line represents the nominal rate of used to call positives. For limma, the counts were normalized using values. Boxplots are based on replicates.

