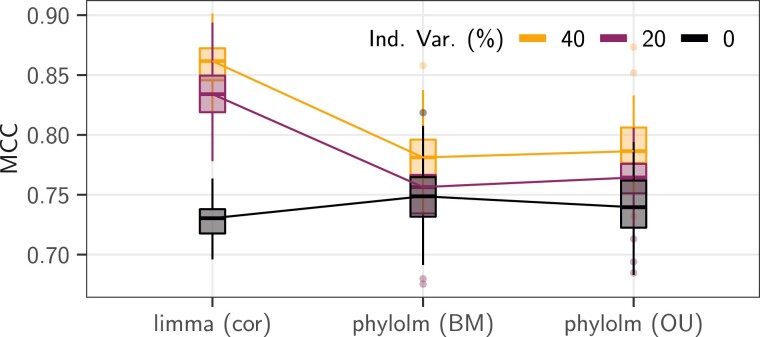
Fig. 6.
Results in terms of MCC scores of the three correlation-aware statistical methods (x axis) on the pPLN base scenario with an effect size of , a BM model of evolution on the maximum likelihood tree (Stern and Crandall 2018a), with the observed “sight” groups, and intraspecies variation accounting for (light orange line), (dark purple line), or (black line) of the total variance). The counts were normalized using values. Boxplots are based on replicates.

