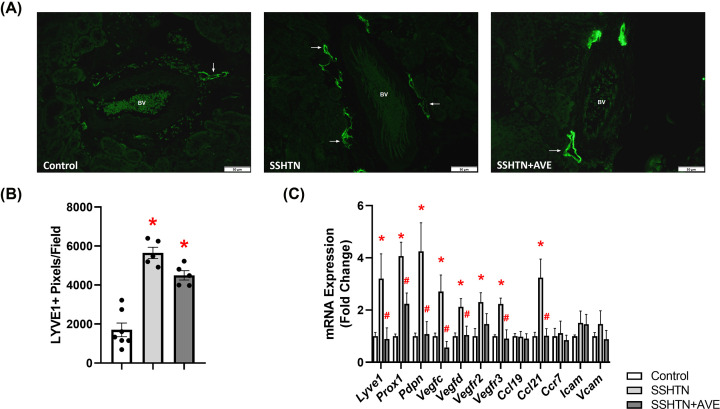
Figure 10. AVE0991 treatment differentially affected lymphatics in the kidneys of female mice with SSHTN.
(A) LYVE1 immunofluorescence in the kidneys of control, SSHTN, and SSHTN+AVE female mice. LYVE1 is labeled green and lymphatic vessels are indicated with arrows surrounding the blood vessels (BV). Images were taken in the cortex at 20×. Scale bars = 50 µm. (B) Renal lymphatic density in control, SSHTN, and SSHTN+AVE female mice as determined by quantification of LYVE1+ pixels per field (n = 5–7 per group). (C) Renal expression changes in lymphangiogenesis-related genes in control, SSHTN, and SSHTN+AVE female mice (n = 4–6 per group). Results are presented as mean ± SEM and all statistical analyses were performed with one-way ANOVA. *P<0.05 vs control mice and #P<0.05 vs SSHTN mice.

