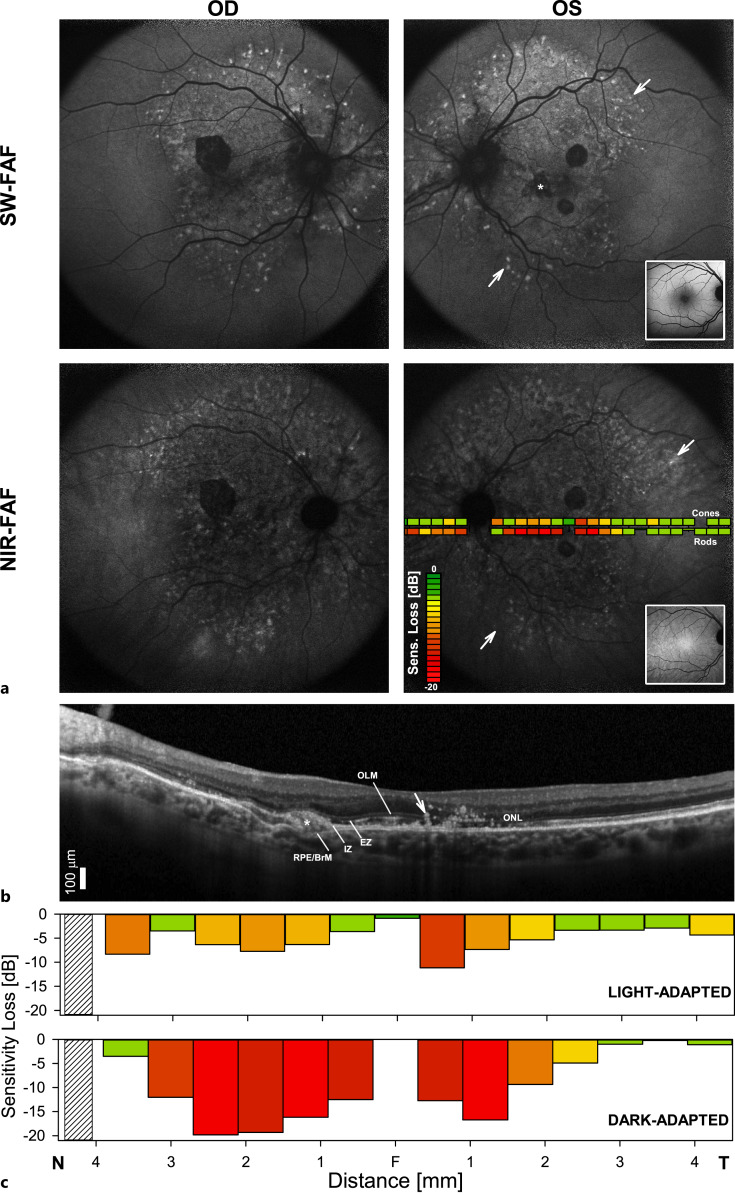
Fig. 3.
Visual function and retinal structure in the patient. a Fundus autofluorescence (FAF) imaging with short-wavelength (SW-FAF) and near-infrared (NIR-FAF) excitation lights in each eye of the patient. Insets on the left eye panels are representative normal images for each FAF modality. Overlaid on the NIR-FAF image of the left eye is perimetric sensitivity losses measured in the light-adapted (cone) and dark-adapted (rod) states plotted following a pseudocolor scheme. A diffuse pattern of hyperautofluorescence interrupted by well-circumscribed hypoautofluorescent lesions in areas of RPE atrophy is seen (asterisk). There is a peripheral leading edge of punctate hyperautofluorescent lesions (arrows). b 9 mm SD-OCT cross-section through the patient’s left fovea. The temporal parafovea retina shows multiple round hyperreflective foci tracking from the RPE toward the inner retina, likely representative of RPE migration. Outer retinal sublaminae are labeled according to conventional nomenclature: outer nuclear layer (ONL); outer limiting membrane (OLM); inner segment ellipsoid region (EZ or ISe); contact cylinder between the apical RPE microvilli and the photoreceptor outer segments tips, or interdigitation zone (IZ); basal RPE and Bruch’s membrane (RPE/BrM). A subretinal deposit replaces a focal EZ and IZ signal laying superficial to the RPR/BrM (arrow). c Light-adapted achromatic and dark-adapted chromatic (500 nm) sensitivity losses (calculated from lower limit of normal = mean − 2 standard deviations) along the horizontal meridian in the patient. Photoreceptor mediation in the dark-adapted state was confirmed rod-mediated for all locations with the use of spectral sensitivity (500 nm–650 nm) differences. Hatched bars denote the location of the blind spot. N, nasal. T, temporal.

